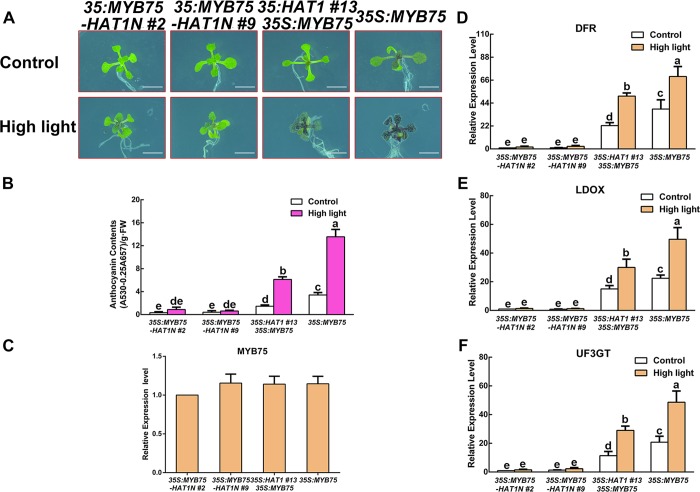
Fig 7. Plants overexpressing MYB75-HAT1N fusion protein exhibit an opposite phenotype contrast to plants overexpressing MYB75.
(A) 14-day-old Arabidopsis seedlings of 35S:MYB75-HAT1N #2, 35S:MYB75-HAT1N #9, 35S:HAT1 #13 35S:MYB75, 35S:MYB75 grown on plates under different conditions. Bars = 0.5 cm. (B) Anthocyanin levels in extracts from seedlings in (A). The experiments were performed in biological triplicate (representing anthocyanin content measured from 15 plants of each genotype and treatment were pooled for one replicate). FW, fresh weight. Error bars denote ± SD (n = 3). Different letters represented statistically significant differences (two-way ANOVA, p<0.05). (C) qPCR analysis of MYB75 transcript levels in 14-day-old seedlings in (A) grown on plates under control conditions, respectively. Expression levels were standardized to ACTIN 8, and results in the Col-0 under control conditions were set at 1. Error bars denote ± SD (n = 3). (D-F) qPCR analysis of DFR, LDOX, and UF3GT expression levels in 14-day-old seedlings in (A) grown on plates under different conditions for 9 h, respectively. Expression levels were standardized to ACTIN 8, the results of Col-0 under control conditions were set at 1. Error bars denote ± SD (n = 3). Different letters represented statistically significant differences (two-way ANOVA, p<0.05).

