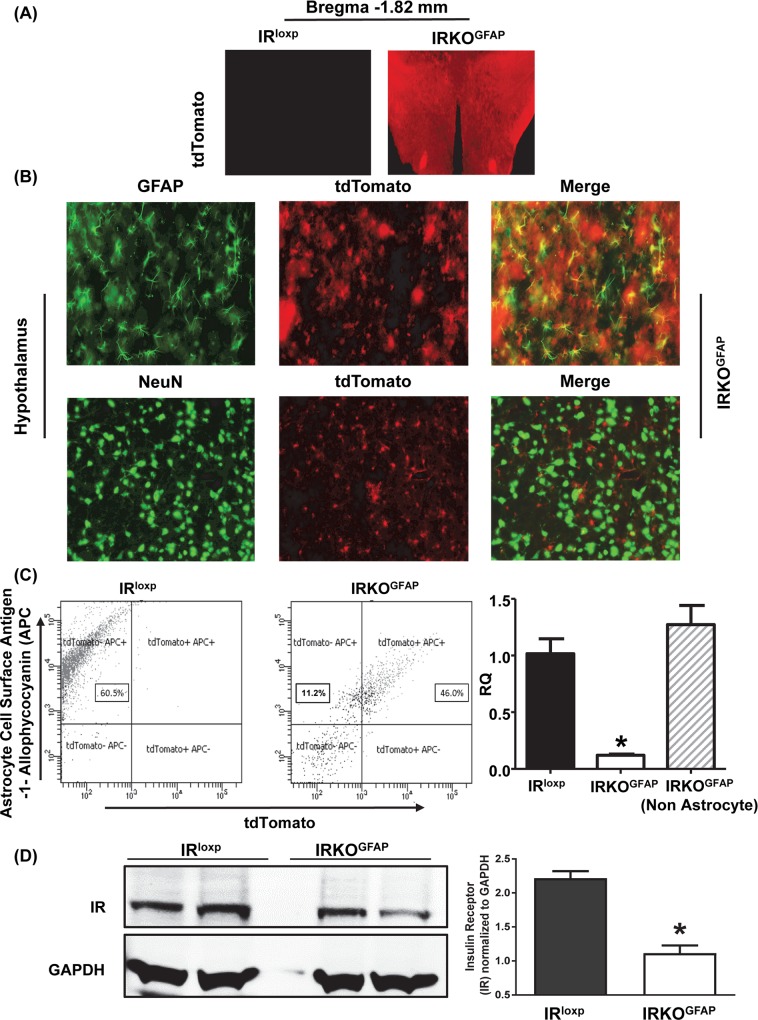
Fig 1. Confirmation of astrocytic IR knockout model (IRKOGFAP).
(A) Experimental study of cross-section of hypothalamus at Bregma −1.82 mm and Bregma −2.30 mm for IRloxp and IRKOGFAP (n = 3–4 per group) using TIRF and confocal microscopy (B) IF cross-sections (50 nm) of hypothalamus for IRKOGFAP stained with GFAP and NeuN antibodies (n = 3–4 per group). (C) FACS dot plot showing the sorting gates for tdTomatolow/APClow, tdTomatolow/APChigh, tdTomatohigh/APClow and tdTomatohigh/APChigh from mice brain hypothalamic cells (n = 2 per group). RTPCR of hypothalamic gene expression levels of isolated astrocytes from FACS were reported as relative quantification (RQ = 2-ΔΔCt) for IRloxp, IRKOGFAP and IRKOGFAP nonastrocyte. IRloxp (black bar), IRKOGFAP (white bar), and IRKOGFAP nonastrocyte (dashed white bar). Values are expressed as means ± SEM. *P < 0.05 IRKOGFAP versus IRloxp group. (D) Western blotting of protein expression from brain tissues were imaged and quantified for IRloxp and IRKOGFAP mice. IRloxp (black bar) and IRKOGFAP (white bar), (n = 4 per group, two brains pooled per lane). Values are expressed as means ± SEM. *P < 0.05 IRKOGFAP versus IRloxp group. The underlying data can be found in S1 Data. APC, allopycocyanin; FACS, fluorescence-activated cell sorting; GFAP, glial fibrillary acidic protein; IR; IRKOGFAP, astrocyte-specific insulin receptor deletion; RQ, relative quantification.

