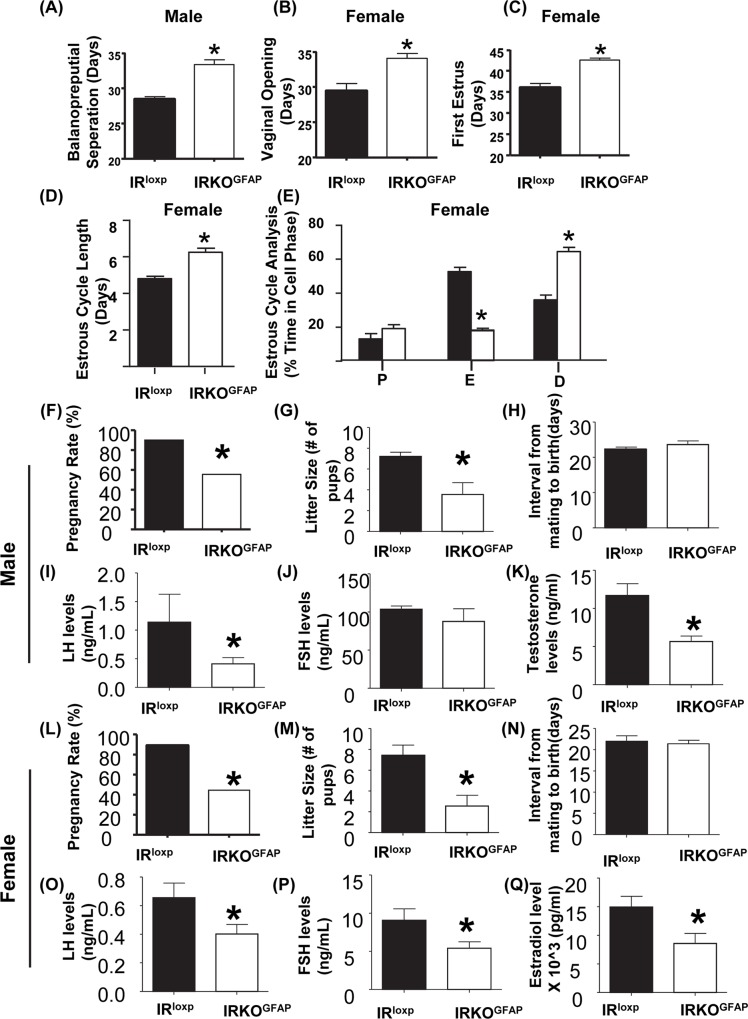
Fig 2. Disruption in pubertal timing and adult fertility.
(A–C) Puberty onset was measured as balanopreputial separation in males and vaginal opening and first estrus in females. IRloxp (black bar), IRKOGFAP (white bar), n = 10–16 per group. (D) Female adult estrus cycle length and cell type analysis. P (predominantly nucleated cells), E (predominantly cornified epithelium cells), D (predominantly leukocytes), n = 10–13 per group. Values are expressed as means ± SEM. *P < 0.05 IRKOGFAP versus IRloxp group. (F–H) Percentage of matings for males resulting in pregnancy. Male litter sizes. Male interval from mating until birth of pups. IRloxp (black bar) and IRKOGFAP (white bar), n = 9–10 for males. Values are expressed as means ± SEM. *P < 0.05 IRKOGFAP versus the IRloxp group. (I–K) LH levels of males. FSH level of males. Testosterone levels of males. (n = 7–9 per group). IRloxp (black bar) and IRKOGFAP (white bar). Values are expressed as means ± SEM. *P < 0.05 IRKOGFAP versus the IRloxp group. (L–N) Percentage of matings for females resulting in pregnancy. Female litter sizes. Female interval from mating until birth of pups. IRloxp (black bar) and IRKOGFAP (white bar), n = 9 for females. Values are expressed as means ± SEM. *P < 0.05 IRKOGFAP versus the IRloxp group. (O–Q) LH levels of females. FSH level of females. Estradiol level of females. (n = 6–8 per group). IRloxp (black bar) and IRKOGFAP (white bar). Values are expressed as means ± SEM. *P < 0.05 IRKOGFAP versus the IRloxp group. The underlying data can be found in S1 Data. D, diestrus; E, estrus; FSH, follicle-stimulating hormone; IR, insulin receptor; IRKOGFAP, astrocyte-specific insulin receptor deletion; LH, luteinizing hormone; P, proestrus.

