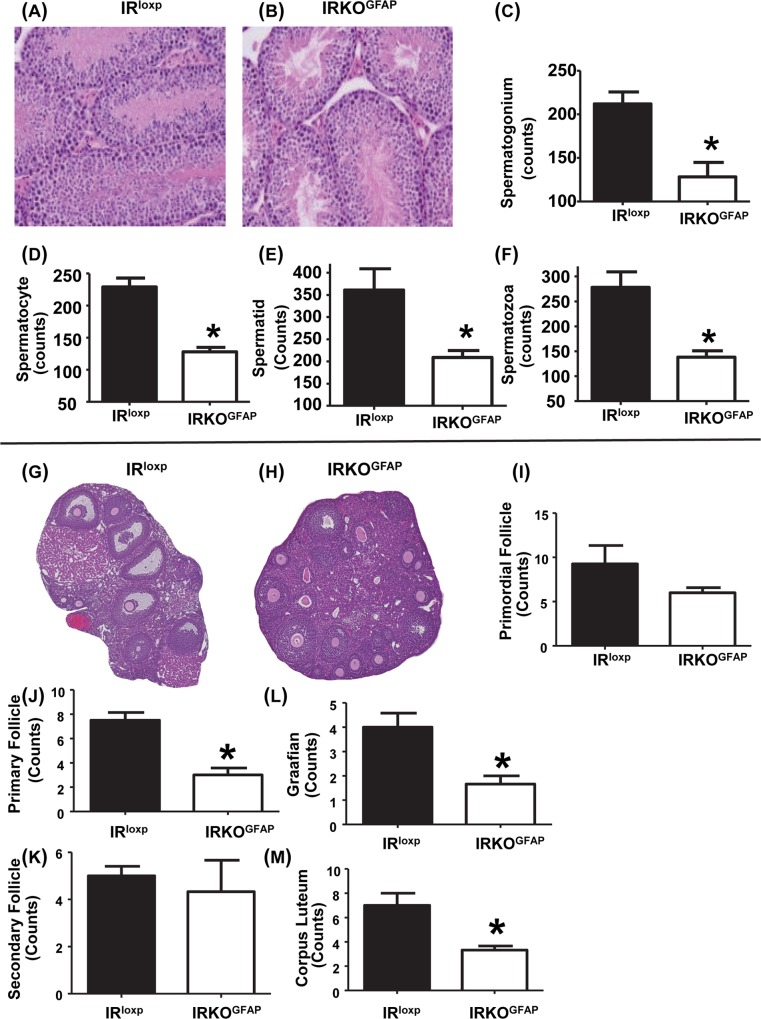
Fig 3. Altered testes morphology and impaired spermatogenesis as well as ovarian morphology and follicle maturation at 6–7 months of age.
(A–B) Histological images of representative IRloxp and IRKOGFAP testes. (C–F) Analysis of number of spermatogonium, spermatocyte, spermatid, and spermatozoa of IRloxp (n = 5) and IRKOGFAP (n = 4). IRloxp (black bar) and IRKOGFAP (white bar). Values are expressed as means ± SEM. *P < 0.05 IRKOGFAP versus the IRloxp group. Histological images of IRloxp (n = 4) and IRKOGFAP (n = 3) female mice IRloxp (black bar) and IRKOGFAP (white bar). (I–M) Ovarian follicle maturation analysis of different follicle stages (primordial, primary, secondary, and Graafian) and corpora lutea in IRloxp (n = 4) and IRKOGFAP (n = 3) mouse ovaries. Values are expressed as means ± SEM. *P < 0.05 IRKOGFAP versus the IRloxp group. The underlying data can be found in S1 Data. IR, insulin receptor; IRKOGFAP, astrocyte-specific insulin receptor deletion.

