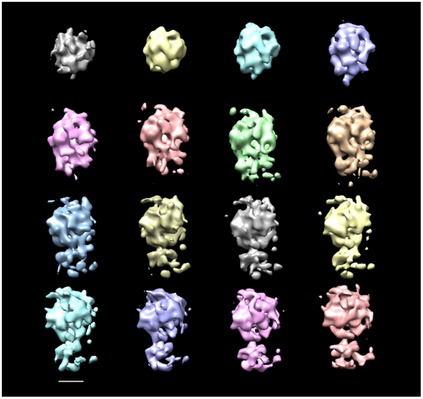
Figure EV1. Subtomogram averaging of decorative nucleosomes.

Initial random reference and averaged subvolumes of decorative nucleosomes like those shown in Fig 2A (region N) through 15 reference‐free alignment iterations; the averaged maps are shown without filtering. Scale bar: 5 nm.
