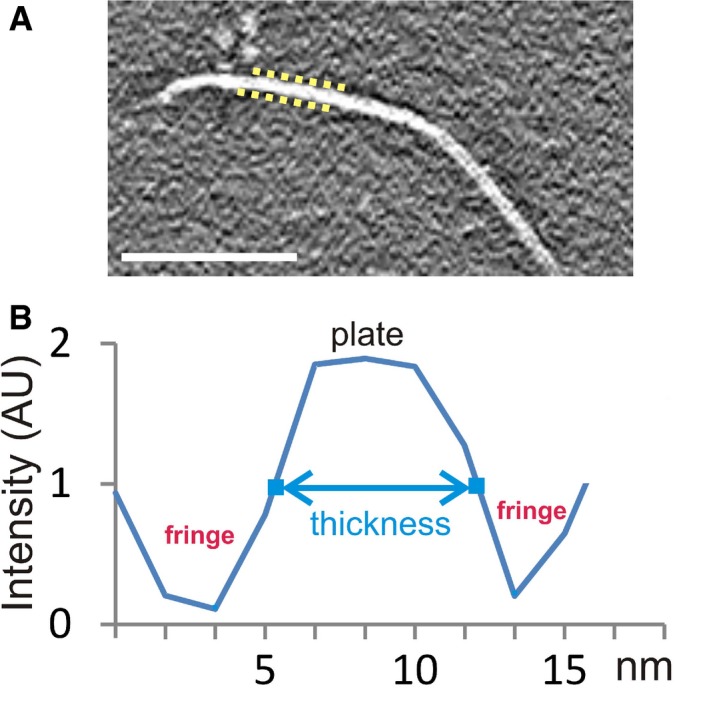
Example of an intensity profile along a vector perpendicular to a plate. Because of the CTF, the plate's intensity values do not have a hard edge, but rather gradually slope from the peak intensities of the plate to the valley of the surrounding CTF fringes. The plate thickness values presented in Table
1 correspond to the distance between the points (indicated in blue), approximately halfway between the peak and the valley. The intensities at these measurement points also roughly correspond to the background intensity of the tomogram. AU, arbitrary units.

