-
A
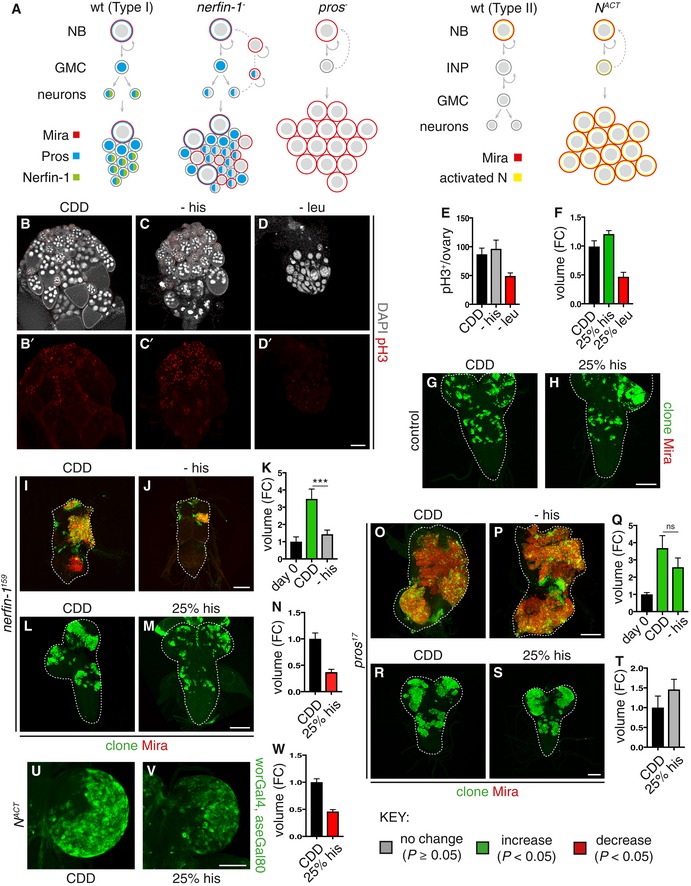
Schematic depicting wildtype NBs (left panel) which express Mira (red), undergoing asymmetric division to generate a GMC, which divides only once to give rise to two postmitotic neurons. The cell fate determinant Pros (blue) is inherited by the GMC, where it translocates to the nucleus to promote differentiation. Postmitotic neurons express Pros (blue) and Nerfin‐1 (green). Upon the loss of Nerfin‐1 (nerfin‐1
−
, middle panel), neurons undergo stepwise reversion, by increasing cellular growth, and switching on stem cell genes while maintaining the expression of neuronal‐specific markers such as Pros, before their complete reversion to NBs, giving rise to clones consisting a mixture of NBs and neurons. In pros
− clones, GMCs fail to differentiate and revert to NBs, giving rise to clones consisting mostly of Mira+ NBs. Schematic depicting type II wildtype NB lineages (left) and dedifferentiation of INP to NBs upon Notch overactivation, which gives rise to clones consisting of mostly NBs (right).
-
B–E
Representative pictures showing that the withdrawal of dietary leu but not his significantly reduced stem cells and follicle cell proliferation (pH3, red) in the adult ovary after 10 days, quantified in (E) (n = 13, 14, 13), scale bar = 100 μm.
-
F–H
Representative pictures showing that wildtype larval NB clonal growth was significantly reduced after 6 days of dietary leucine depletion (25% leu) and significantly increased by dietary histidine depletion (25% his), quantified in (F) (n = 28, 22, 7), scale bar = 50 μm
-
I–K
Representative pictures showing that adult nerfin‐1 clonal growth was significantly reduced on −his diet compared to CDD (measured at day 0, and day 9) quantified in (K) (n = 27, 110, 136). Scale bar = 75 μm. ***P < 0.001
-
L–N
Representative pictures showing that larval nerfin‐1 clonal growth was significantly reduced on 25% his diet compared to CDD (after 6 days), quantified in (N) (n = 53, 36). Scale bar = 50 μm.
-
O–Q
Representative pictures showing that adult pros clonal growth was not significantly altered on −his diet compared to CDD (after 7 days), quantified in (Q) (n = 12, 23, 16). Scale bar = 75 μm.
-
R–T
Representative pictures showing that larval pros clonal growth was not significantly altered by dietary histidine reduction (25% his) compared to CDD (after 6 days), quantified in (T) (n = 19, 13). Scale bar = 50 μm.
-
U–W
Representative pictures showing that the growth of larval type II lineages overexpressing NACT significantly reduced dietary histidine reduction (25% his) compared to CDD, quantified in (W) (n = 27, 19). Scale bar = 100 μm.
Data information: In all graphs, the key indicates that green bars represent a significant increase (
‐tests with the relevant paired controls (black bar). In all graphs, error bars represent 1 standard error of the mean (SEM). FC, fold change. See also Figs
.

