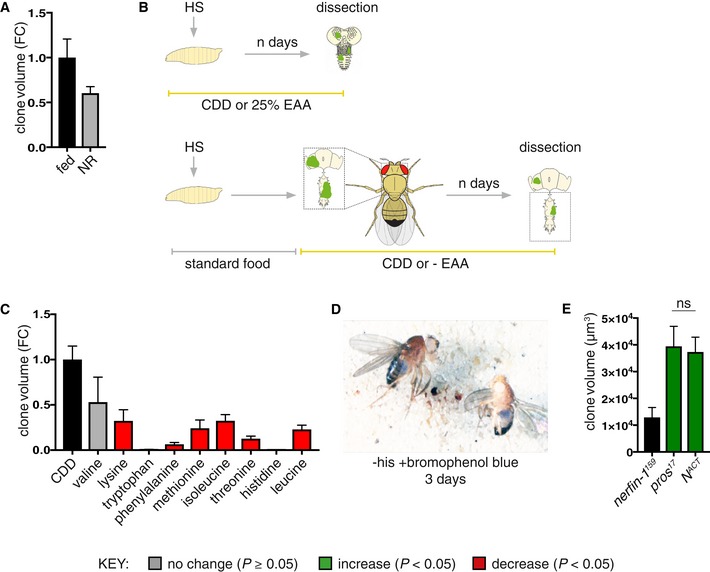
nerfin‐1 clones were induced at 48 h ALH and transferred to standard Drosophila media or agarose/PBS (nutrient restriction, NR) for 3 days, and clone size is reduced (though not significantly, P = 0.054) under NR (n = 90, 116).
Schematic depicting heat shock and dissection regimes for larval and adult EAA dietary manipulations.
Volume (fold change) of the sum of GFP+
nerfin‐1 clones per CNS in animals where clones were induced at 48 h ALH for 1 h and evaluated after 9 days of feeding on CDD or CDD‐EAAs (n = 17, 3, 8, 5, 12, 5, 10, 10, 17, 9).
w
118 adults (left, female, right, male) were fed a −his diet labelled with bromophenol blue; blue food was detected in the gut after 3 days of feeding.
Larval nerfin‐1, pros and N
ACT clone volume, clones were induced at 48 h ALH and measured at 6 days ALH (n = 26, 11, 16). pros and N
ACT are of comparable volume, ns = not significant.
Data information: In all graphs, the key indicates that green bars represent a significant increase (
P < 0.05), red bars a significant decrease (
P < 0.05), and grey bars no significant change (
P > 0.05) in
t‐tests with the relevant paired controls (black bar). In all graphs, error bars represent 1 standard error of the mean (SEM). FC, fold change.

