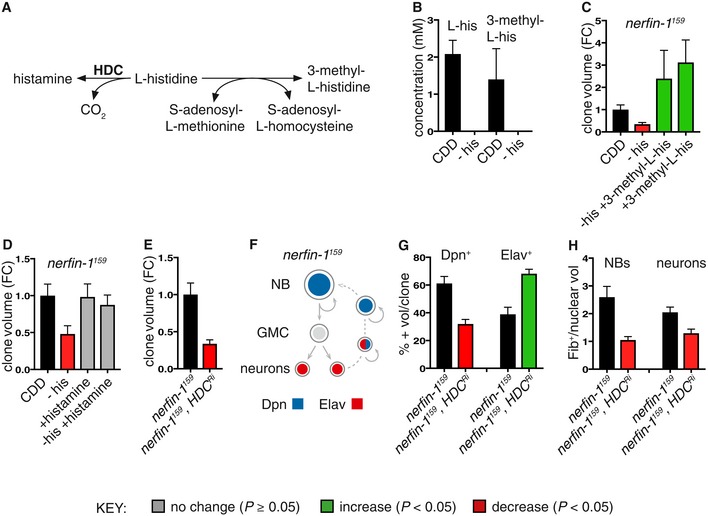
Schematic depicting the metabolic reaction between histidine and its downstream metabolites histamine and 3‐methyl‐L‐histidine.
Concentration of histidine and 3‐methyl‐L‐histidine from whole Drosophila adults extracts measured by 1H NMR after 3 days of feeding on either CDD or −his diet (n = 3, 3). Both compounds are reduced to below detection levels (< 0.3 mM) upon dietary his depletion.
Dietary supplementation of 3‐methyl‐L‐his for 4 days significantly increased adult nerfin‐1 clonal growth and rescued nerfin‐1 growth inhibition due to his dietary withdrawal (n = 18, 14, 7, 9).
Dietary supplementation of histamine does not significantly increase adult nerfin‐1 clone size, but can rescue nerfin‐1 clonal growth inhibition due to his dietary withdrawal (n = 42, 14, 23, 25).
Larval nerfin‐1 clonal growth is significantly decreased upon overexpression of HDC RNAi (n = 23, 36).
Schematic depicting stepwise neurons to NBs reversion in nerfin‐1 type I lineages where neurons express Elav, NBs express Dpn, and reverting neurons express both markers.
Hdc inhibition significantly reduced the percentage of Dpn+ NBs (n = 16, 17) and significantly increased the percentage of Elav+ neurons per clone (n = 16, 17).
HdcRi overexpression reduced cellular growth of nerfin‐1 NBs (n = 17, 19) and neurons (n = 36, 19) measured as the ratio of nucleolus/nuclear volume.
Data information: In all graphs, the key indicates that green bars represent a significant increase (
P < 0.05), red bars a significant decrease (
P < 0.05), and grey bars no significant change (
P > 0.05) in
t‐tests with the relevant paired controls (black bar). In all graphs, error bars represent 1 standard error of the mean (SEM). FC, fold change. See also Figs
EV2 and
EV3.

