-
A–D
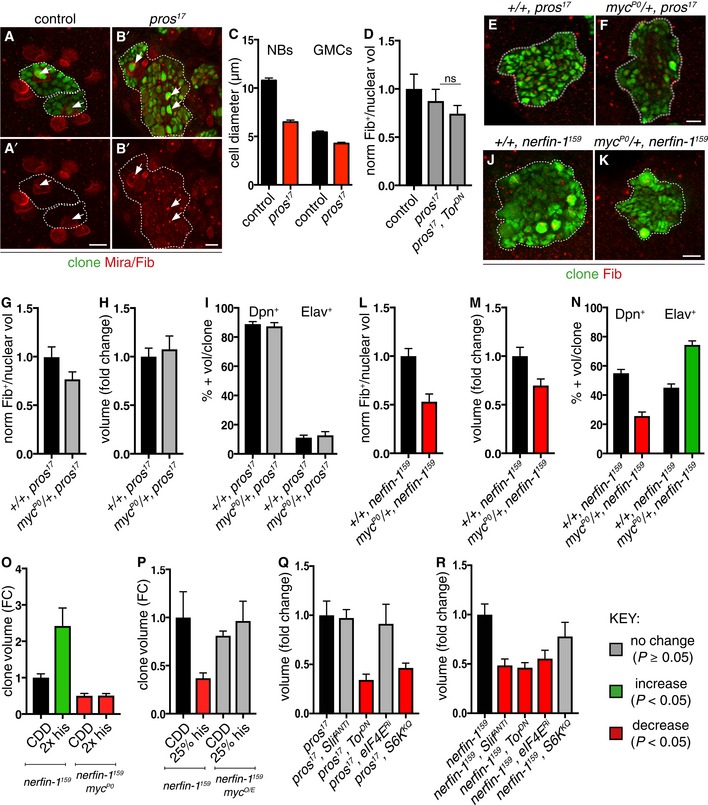
Representative pictures showing that pros NBs and GMCs are smaller than wildtype (NBs and GMCs are distinguished at telophase, as a doublet of unequal size), quantified in (C) (n = 25, 31, 21, 16). pros NBs exhibit similar nucleolus/nuclear ratio (white arrows, nucleolus marked by Fib) compared to wildtype and pros;Tor
DN NBs, quantified in (D) (n = 10, 18, 15).
-
E–I
Representative pictures showing pros clones (green) generated in myc hypomorphic background did not significantly alter pros nucleolus/nuclear ratio (E, F), nucleolus labelled with Fib (red) [quantified in (G) (n = 44, 43)], clone size [quantified in (H) (n = 41, 34)] or the proportion of Dpn+ NBs and Elav+ neurons per clone [quantified in (I) (n = 15, 15, 15, 15)].
-
J–N
Representative pictures showing that nerfin‐1 clones (green) generated in myc hypomorphic background (J, K) exhibited significantly reduced nucleolus/nuclear ratio, [nucleolus labelled with Fib (red)] and reduced clone size, quantified in (L) (n = 34, 27) and (M) (n = 106, 75), and displayed an increased proportion of differentiated Elav+ neurons and reduced proportion of Dpn+ NBs per clone, quantified in (N) (n = 20, 20, 20, 20). scale bar = 10 μm
-
O
Reducing Myc dosage with the hypomorphic Myc allele, myc
P0, abolished the increase in nerfin‐1 clone size mediated by 2× histidine dietary intake, 2× his (n = 41, 18, 10, 57).
-
P
Overexpression of myc restored the growth of nerfin‐1 clones inhibited by histidine dietary reduction, 25% his (n = 51, 36, 39, 29).
-
Q, R
pros (Q) and nerfin‐1 (R) clones are reduced upon Tor inhibition (n = 22, 63) compared to control (n = 51, 65), but their growth differentially depends on amino acid transporter Slif (n = 12, 32) and downstream growth regulators eIF4E (n = 21, 47) and S6K (n = 39, 37).
Data information: In all graphs, the key indicates that green bars represent a significant increase (
‐tests with the relevant paired controls (black bar). In all graphs, error bars represent 1 standard error of the mean (SEM). FC, fold change. See also Fig
.

