-
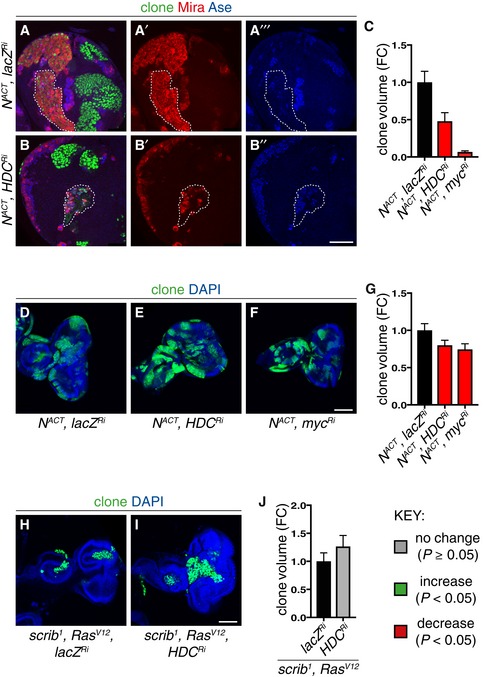
A–C
Representative pictures showing that larval type II NACT MARCM clonal growth was significantly reduced by Hdc (A–B’’) and Myc knockdown, quantified in (C) (n = 11, 7, 7). Scale bar = 50 μm.
-
D–G
Representative pictures showing that Myc (F) and Hdc (E) inhibition was sufficient to significantly reduce N
ACT clonal growth in the larval eye imaginal epithelia, quantified in (G) (n = 75, 80, 75). Scale bar = 100 μm.
-
H–J
Hdc inhibition did not significantly alter the growth of scrib
1
;Ras
V12 larval eye imaginal epithelia clones, quantified in (J) (n = 57, 33). Scale bar = 100 μm.
Data information: In all graphs, the key indicates that green bars represent a significant increase (
P < 0.05), red bars a significant decrease (
P < 0.05), and grey bars no significant change (
P > 0.05) in
t‐tests with the relevant paired controls (black bar). In all graphs, error bars represent 1 standard error of the mean (SEM). FC, fold change.

