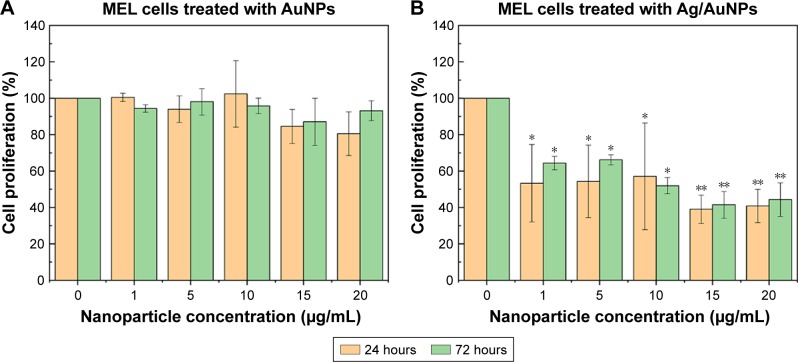
Figure 12.
MTS assay on melanoma cells in the presence of AuNPs (A) and Ag/AuNPs (B) at concentrations ranging from 1 to 20 µg/mL. Data = mean ± SD, N=3. *p<0.01 versus control (0 µg/mL concentration), **p<0.005 versus control (0 µg/mL concentration). Statistical analysis performed was based on a t-distribution.
Abbreviations: AgNPs, silver nanoparticles; AuNPs, gold nanoparticles.

