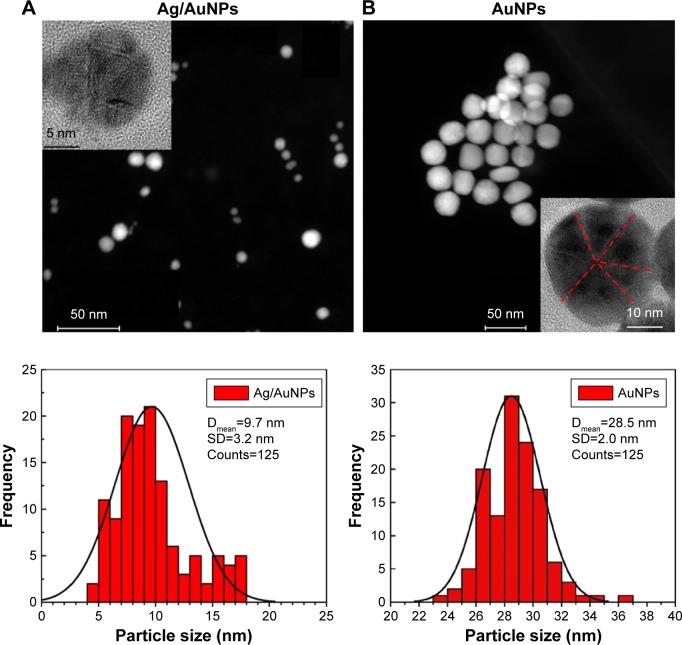
Figure 6.
STEM images and particle size distribution for (A) Ag/AuNPs and (B) AuNPs. Insets: HRTEM images. The red lines in the HRTEM image in (B) show the twin planes in the Au nanocrystals.
Abbreviations: AgNPs, silver nanoparticles; AuNPs, gold nanoparticles; Dmean, mean particle size; HRTEM, high-resolution transmission electron microscopy; STEM, scanning transmission electron microscopy.

