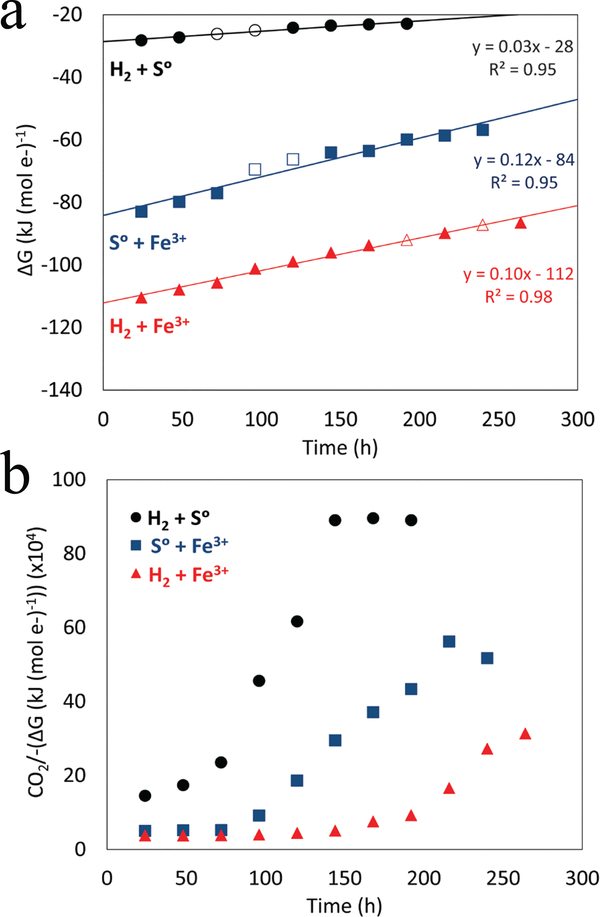
Fig. 2. Available Gibbs free energy (ΔG) per mol e- transferred in DS80 cultures provided with H2/S°, S°/Fe3+, and H2/Fe3+.
Trends in the data are illustrated with the least-squares best-fit regressions. The standard deviations of the slope of the regression for H2/S°, S°/Fe3+, and H2/Fe3+ grown cultures are 0.002, 0.010, 0.004, respectively. Empty circles represent logarithmic growth and are the points where generation times and growth yields were calculated (a). Carbon assimilated (fmol) divided by the negative value of (ΔG) per mol e- transferred in cultures of DS80 provided with H2/S°, S°/Fe3+, and H2/Fe3+ as a function of incubation time (b).

