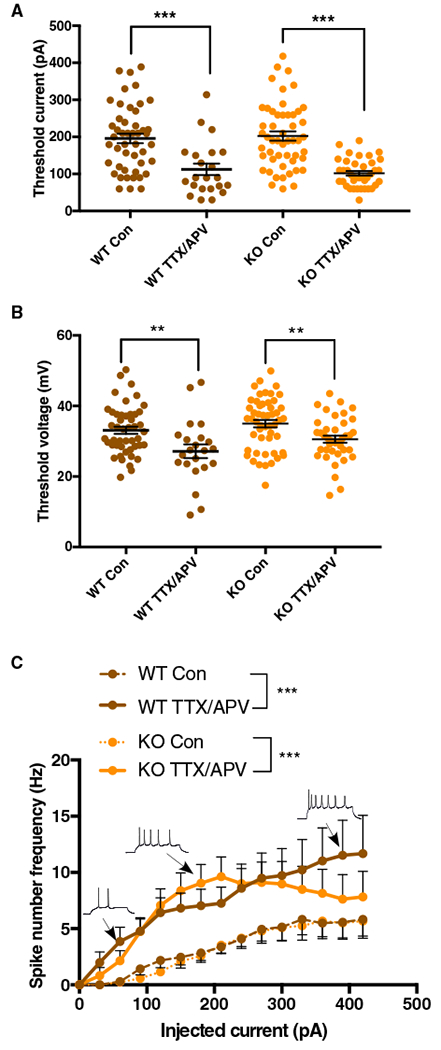
Figure 1. Fmr1 KO Neurons Do Not Display Differences in Baseline Intrinsic Excitability Levels or Homeostatic Intrinsic Plasticity.

(A and B) Action potential threshold current (A) and voltage (B) in control and TTX/APV conditions (two-way ANOVA [α = 0.05]: threshold current, F[1, 155] = 53.6; Bonferroni: p < 0.001; threshold voltage, F[1, 156] = 18.31; Bonferroni: p < 0.01).
(C) Measurement of spike number frequency in control and TTX/APV conditions (GLM [alpha = 0.05], three-way interaction [coefficient = 0.199, SE = 0.042, Z value = 4.658, p < 0.001)].
Post hoc significance testing was done by first calculating the grand mean of number of spikes for each cell (across all steps) and then comparing those means using the Wilcoxon nonparametric test (alpha = 0.05) (WT: W = 226, p = 0.0001; KO: W = 552, p = 0.0003). Error bars indicate SEM. WT control, n = 47 cells/12 litters; WT TTX/APV, n = 23/5; KO control, n = 51/13; KO TTX/APV, n = 39/10. Con, control. See also Table S1. **p < 0.01 and ***p < 0.001.
