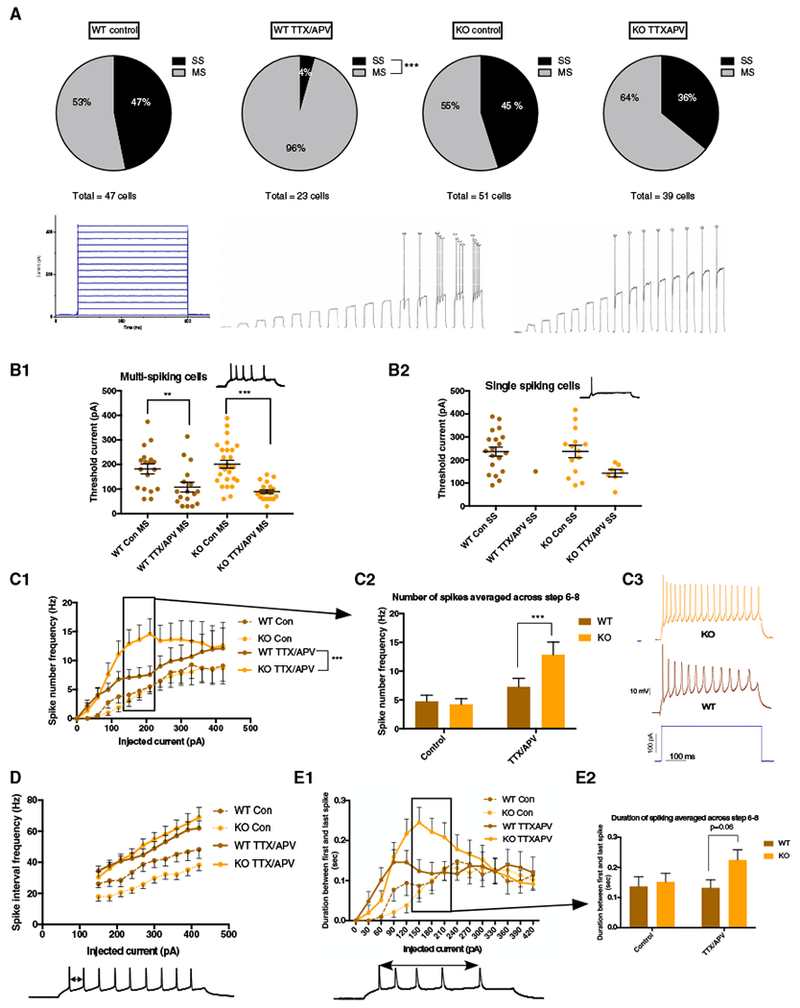
Figure 2. Cortical Fmr1 KO Neurons Display Cell Population-Specific Alterations in Homeostatic Intrinsic Plasticity.

(A) Top: WT neurons significantly reduced the number of SS cells following TTX/APV (proportion Z test [two-tailed, α = 0.05] p < 0.0001), while KO SS cells failed to convert. Bottom: current injection protocol and example traces from multi-spiking and single-spiking neurons across all 15 current steps.
(B1) Reduced threshold current in MS cells following TTX/APV (two-way ANOVA [α = 0.05]: F[1, 97] = 34.84; Bonferroni: WT: p = 0.01, KO: p < 0.0001).
(B2) Trend toward reduced threshold in SS cells following TTTX/APV (two-way ANOVA [α = 0.05]: F[1, 54] = 3.32; Bonferroni: p = 0.07).
(C1 and C2) Spike number frequency in control and TTX/APV MS cells (GLM [α = 0.05], three-way interaction among drug, current, and genotype [coefficient = 0.235, SE = 0.045, Z value = 5.21, p < 0.001)]. Wilcoxon post hoc significance testing was done by combining spike number frequency data from steps 6, 7, and 8 and found significant differences in these current steps between MS WT and KO after TTX/APV (W = 3, 131, p = 0.0007).
(C3) Example traces from TTX/APV-treated WT and KO MS cells.
(D) Spike interval frequency in control and TTX/APV MS cells.
(E1 and E2) TTX/APV KO MS cells display trends toward longer duration of spiking during steps 6–8 compared with WT (two-way ANOVA [α = 0.05]: interaction effect F(1, 77) = 1.56; Bonferroni: p = 0.06).
Error bars indicate SEM. Con, control; MS, multi-spiking; SS, single-spiking. Number of cells in each condition: WT control (MS = 25 cells, SS = 22 cells, 12 litters), WT TTX/APV (MS = 22 cells, SS = 1 cell, 5 litters), KO control (MS = 28 cells, SS = 23 cells, 13 litters), and KO TTX/APV (MS = 25 cells, SS = 14 cells, 10 litters). See also Figure S1 and Tables S1–S3. **p < 0.01 and ***p < 0.001.
