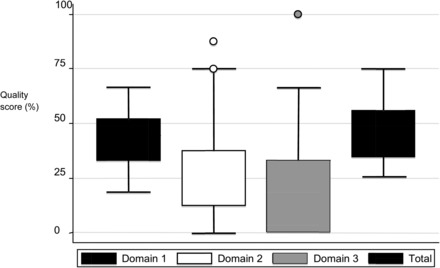
FIGURE 2.

Median (range, IQR) quality scores for each methodologic domain (1 = “study design,” 2 = “statistical methods,” 3 = “reporting methods”) and for all included studies. For domain 2, the circle above the error bars represents the 2 outlier studies given the highest score (87.5%) under this domain. Similarly, for domain 3, the circle above the error bars represents the 1 outlier study given the highest score (100%) under this domain.
