
Fig. 3.
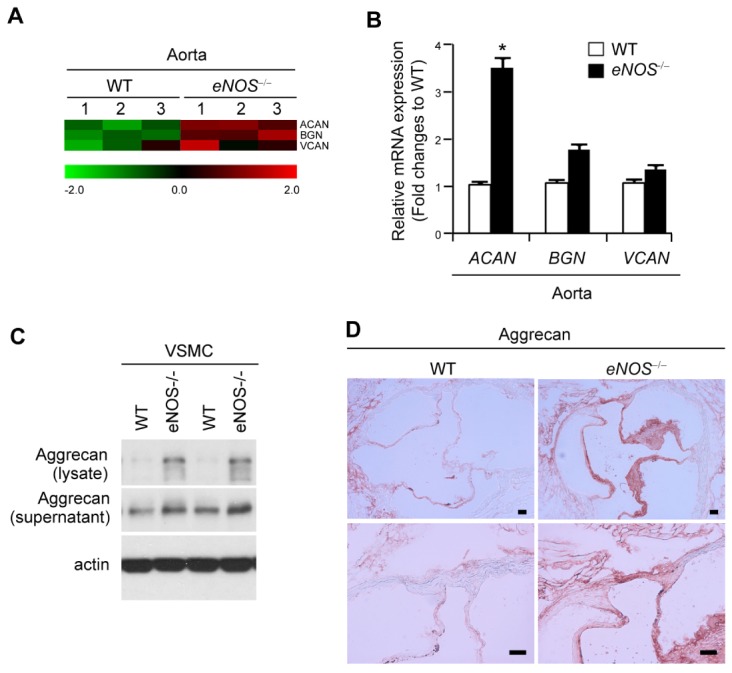
Elevated expression of aggrecan in aorta from eNOS−/− mouse. (A) Gene expression profiles of remodeling-associated genes. Transcripts that are upregulated and downregulated are shown in red and green, respectively. The columns represent the aorta samples from WT or eNOS−/− mice. (B) The levels of mRNA expression of aggrecan (Acan), biglycan (Bgn), and versican (Vcan) were compared in aorta from WT and eNOS−/− mice using qPCR. *P < 0.05 compared to WT control. P values were calculated using Kruskal-Wallis test. (C) Protein expression of aggrecan and β-actin were detected by western blotting in VSMCs. (D) Representative photographs of immunohistochemistry staining of aggrecan in aortic sinus sections from WT and eNOS−/− mice. Scale bars, 100 μm.