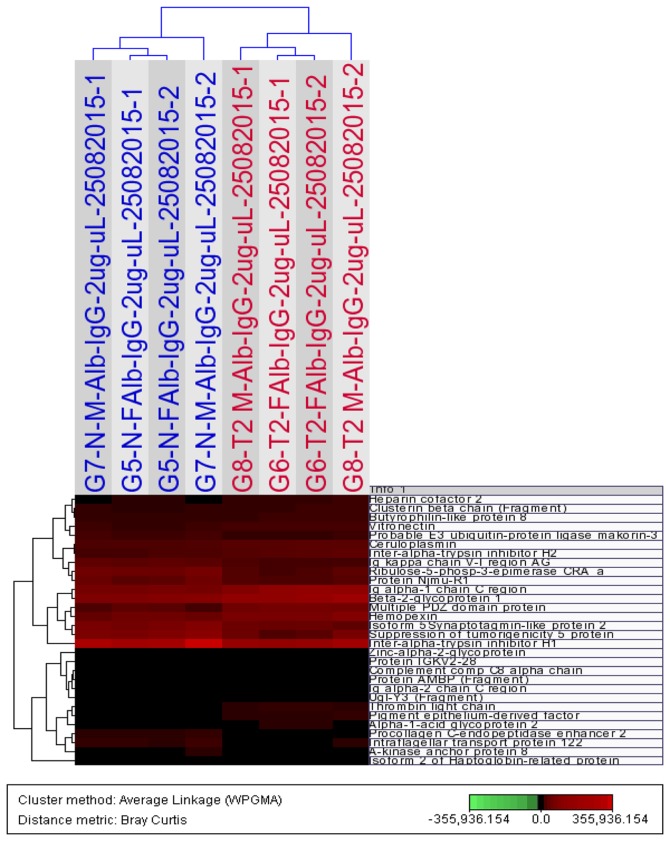
Figure 2.
Hierarchical Cluster Analysis of the expression profiles of non-depleted serum samples using 30 proteins that differ significantly (P<0.05, analysis of variance; maximum fold change ≥1.5) between all controls (males and females; blue) subjects and all subjects with type 2 diabetes mellitus (red). The dendrogram was generated using the Bray Curtis Correlation distance metric and an average linkage clustering method from the J-Express Pro V1.1 software (java.sun.com).

