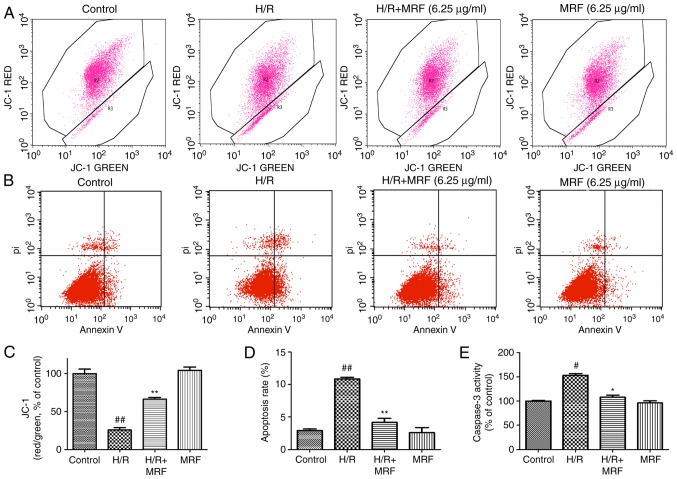
Figure 6.
Effects of MRF on H/R-induced apoptosis. (A) Scatter diagram of JC-1 staining, as measured using flow cytometry. (B) Scatter diagram of Annexin V-PI double staining, as measured using flow cytometry. (C) The quantitative analysis of the ratio of red to green fluorescence intensity. (D) The quantitative analysis of apoptosis rate. (E) Caspase-3 activity was measured using a fluorometric assay. The data are presented as the mean ± standard deviation from three independent experiments. #P<0.05 vs. the control, ##P<0.01 vs. the control; *P<0.05 vs. H/R-treated cells, **P<0.01 vs. H/R-treated cells. MRF, Myrica rubra flavonoids; H/R, hypoxia/reoxygenation; PI, propidium iodide.

