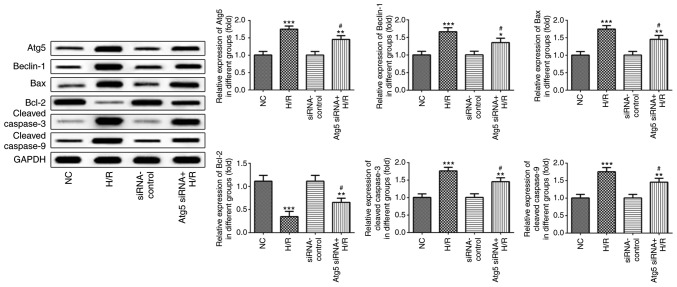
Figure 7.
Expression levels of apoptotic proteins and autophagic proteins and their quantitative evaluation in cells cultured under H/R conditions or in cells transfected with Atg-siRNA. All data are expressed as the mean ± standard deviation. *P<0.05, **P<0.01 and ***P<0.001, vs. NC; #P<0.05, vs. H/R. siRNA-control and NC did not differ significantly. miR, microRNA; H/R, hypoxia/reoxygenation; NC, negative control; siRNA, small interfering RNA; Atg5, autophagy-related 5; Bcl-2, B-cell lymphoma 2; Bax, Bcl-2-associated X protein.

