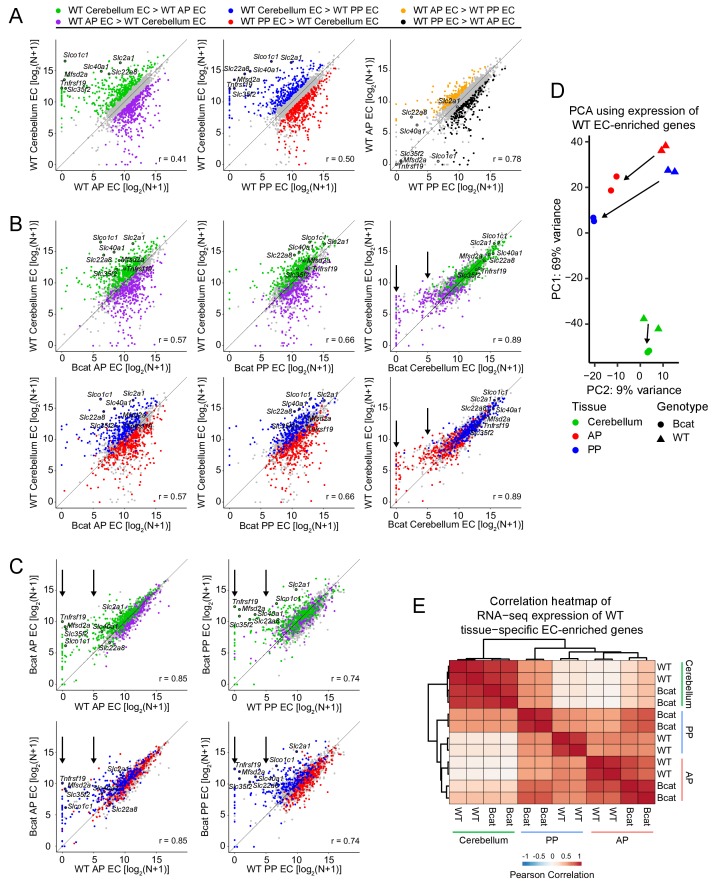
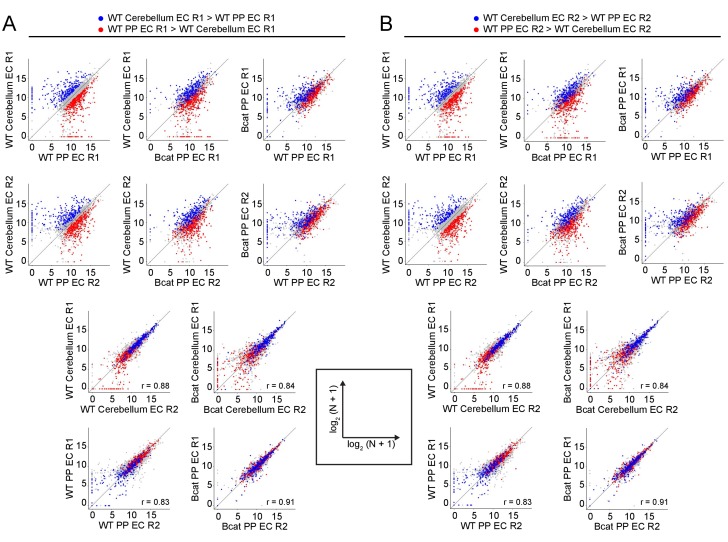
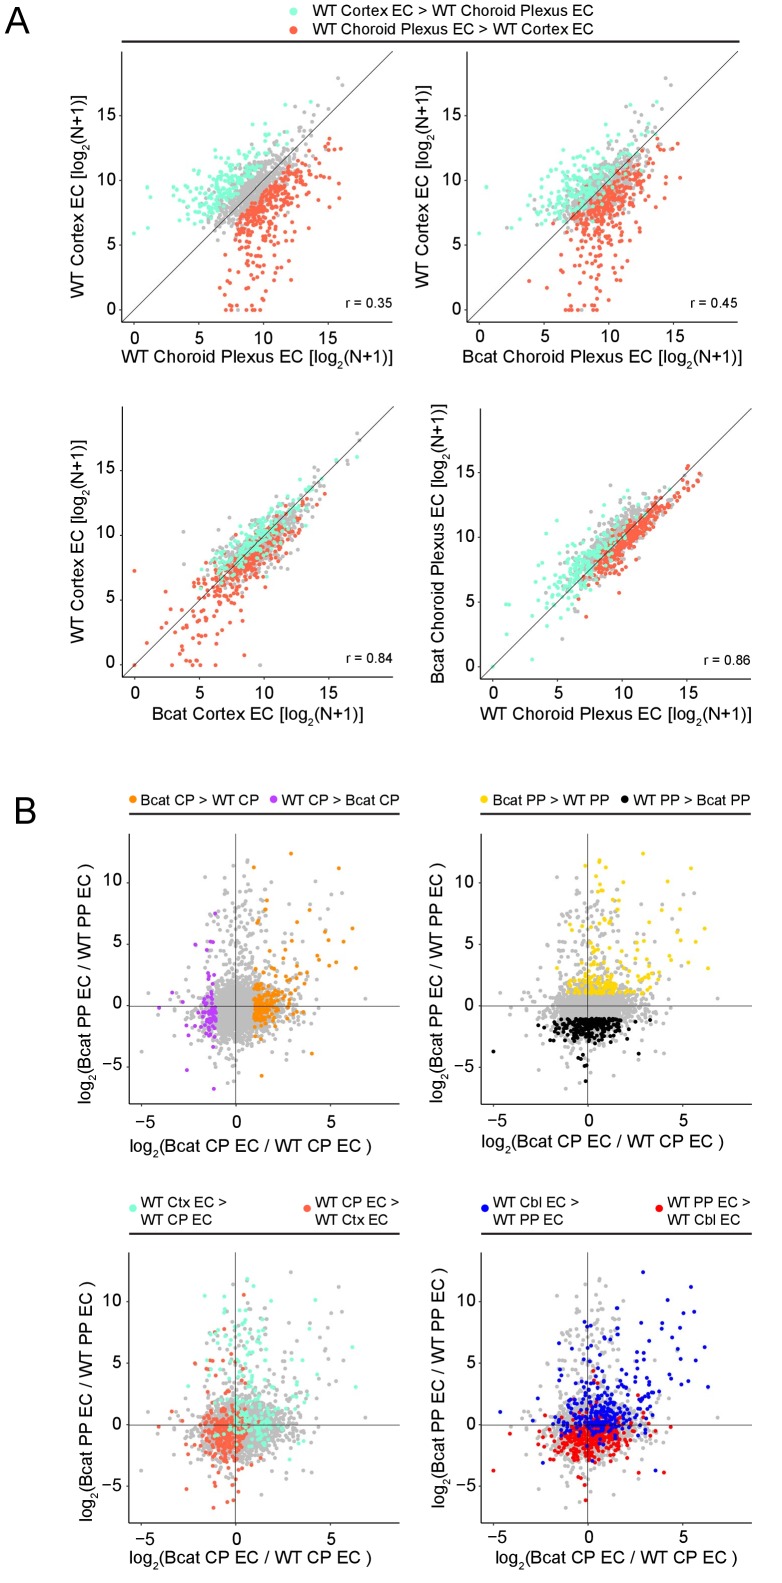
Figure 7. Genome-wide visualization of transcriptome differences in ECs from different tissues for WT vs.beta-catenin stabilized samples.
(A) Scatter plots comparing cross-sample normalized RNA-seq read counts of EC-enriched protein-coding genes from cerebellum ECs vs. anterior pituitary (AP) ECs, cerebellum ECs vs. posterior pituitary (PP) ECs, and anterior pituitary ECs vs. posterior pituitary ECs. Values depicted are the log2 transformation of cross-sample normalized RNA-seq read counts + 1. Colored symbols indicate transcripts with false discovery rate (FDR) < 0.05 and enrichment >2 fold for the indicated comparisons. The same set of seven BBB-associated transcripts are labeled in each scatterplot and their associated datapoints are enclosed by black circles. All data in this figure are averages of two independent samples. (B) Scatter plots comparing cross-sample normalized RNA-seq read counts of EC-enriched protein-coding genes from WT cerebellum ECs vs. beta-catenin stabilized anterior pituitary ECs, posterior pituitary ECs, and cerebellum ECs. Colored symbols are as defined in (A). (C) Scatter plots comparing cross-sample normalized RNA-seq read counts of EC-enriched protein-coding genes between genotypes for anterior pituitary ECs and posterior pituitary ECs. Vertical arrows in (B) and (C) indicate multiple data points that change upon beta-catenin stabilization. (D) Principal component analysis of all WT EC-enriched transcripts from cerebellum ECs, anterior pituitary ECs, and posterior pituitary ECs. The two symbols for each sample represent biological replicates. Most of the variance is explained by PC1 which separates the samples by tissue of origin. Arrows indicate changes upon beta-catenin stabilization. (E) Heatmap indicating pairwise Pearson correlations for RNA-seq TPM among WT and beta-catenin-stabilized ECs for tissue-specific EC protein-coding genes. Data are shown for the individual replicates. AP, anterior pituitary; PP, posterior pituitary.


