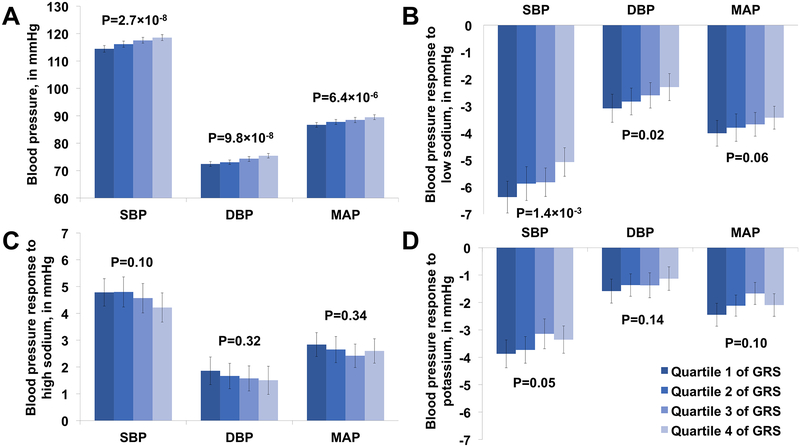
Figure 1. Blood pressure and blood pressure responses to interventions.
a. Baseline blood pressure, in mmHg, per quartile of each GRS.
b. Blood pressure response to a low-sodium intervention, in mmHg, per quartile of each GRS.
c. Blood pressure response to a high-sodium intervention, in mmHg, per quartile of each GRS.
d. Blood pressure response to a potassium intervention while maintaining a high-sodium diet, in mmHg, per quartile of each GRS.
DBP=Diastolic blood pressure; GRS=Genetic risk score; MAP=Mean arterial pressure; SBP=Systolic blood pressure

