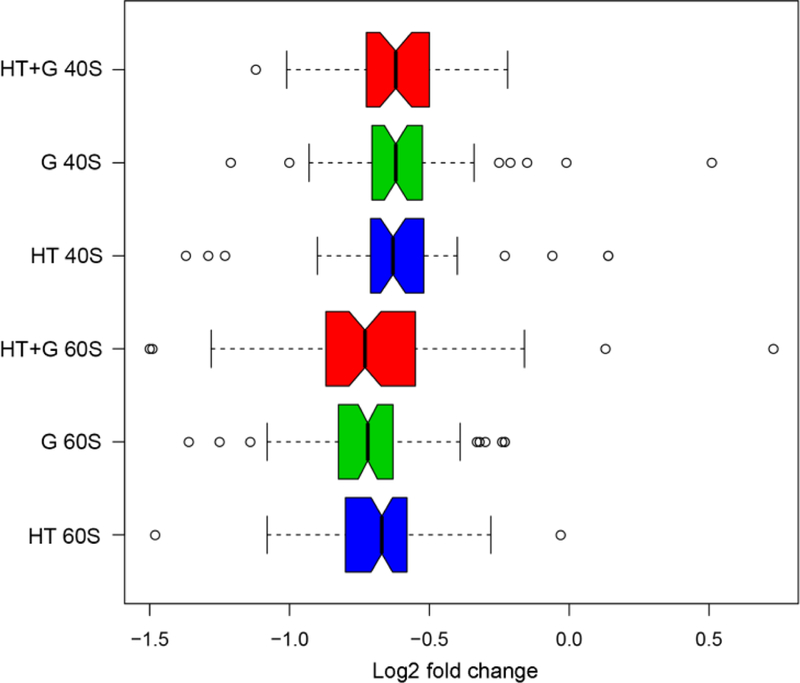
Figure 1. The log2 fold-changes in the distributions of 40S and 60S subunit protein abundances caused by changes in growth conditions.

Quantitative proteomics was used to identify and quantify changes in individual r-proteins abundances from S. cerevisiae whole-cell protein extracts after shifts in carbon source and temperature [41]. Yeast was grown at standard conditions (glucose, 30° C) and changed to three different environmental growth conditions or stimuli: high temperature 39° C (HT, blue); glycerol (G, green), and high temperature and glycerol combined (HT+G, red). A custom Python script CompZilla.py was used to analyze changes in the r-proteins in the quantitative proteomic data. Open circles represent r-protein outliers in the log2 fold-changes in their protein abundance.
