
Figure 3: MYBPC3 expression in HCM iPSC-CMs.
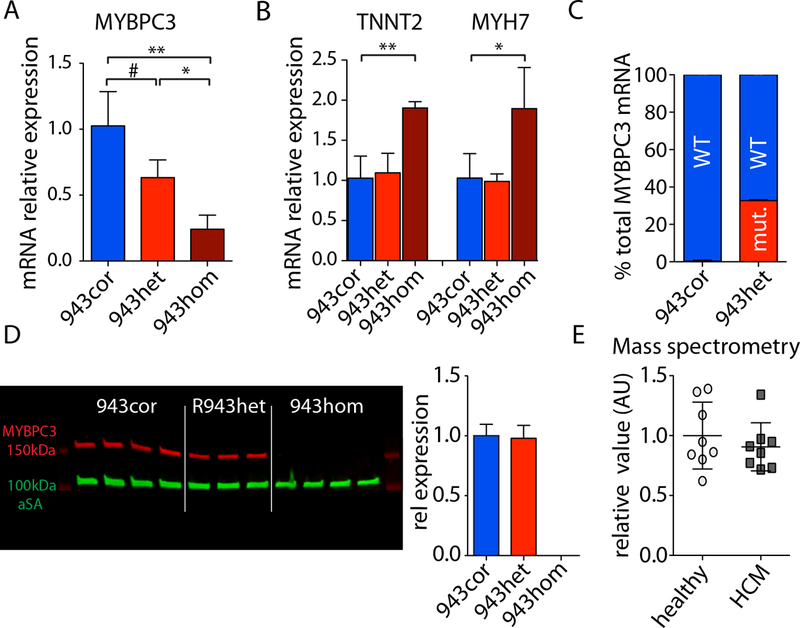
(A,B) Total MYBPC3, troponin T (TNNT2), and myosin heavy chain 7 (MYH7) mRNA expression in isogenic iPSC-CMs measured by qPCR (943cor, 943het, 943hom; n=3–4, respectively). (C) Fraction of mutant mRNA (mut.) and wild type (WT) within total MYBPC3 mRNA accounts for 32.7% ± 0.6% in 943het iPSC-CMs (quantification using RNA-seq data; 943cor and 943het; n=3, respectively). (D) Western blot analysis of MYBPC3 protein levels and quantification of MYBPC3 protein expression normalized to alpha sarcomeric actin (αSA) in isogenic iPSC-CMs (using Santa Cruz E7 anti-MYBPC3; 943cor and 943het). (E) Mass spectrometry analysis of MYBPC3 protein expression in healthy (943cor, ctrl) and HCM (943het, ctrl943) iPSC-CMs (n=4 differentiation batches, respectively). # p<0.1; * p<0.05; ** p<0.01.