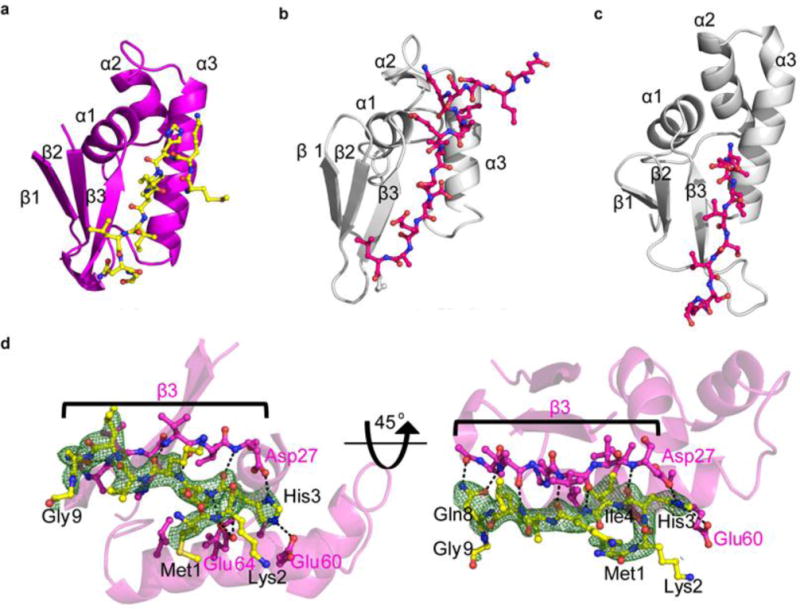
Figure 4.

Leader peptide and binding to RRE of CteB. Comparison of RRE domains from CteB (a), LynD (b), NisB (c). d) Simulated annealing omit composite map (2Fo-Fc) contoured to 1.0 σ of residues 1 – 9 of the leader peptide (yellow sticks) of CteA. Residues from CteA involved in binding of the leader peptide are shown in yellow. Hydrogen bond interactions are shown as dashed lines. β3 from the RRE domain is shown in pink sticks. β3 forms extensive hydrogen bonds to the leader peptide of CteA, while α3 forms mostly hydrophobic interactions, with the exception of Glu60 and Glu64. For full list of interactions and distances see supplementary Table S6.
