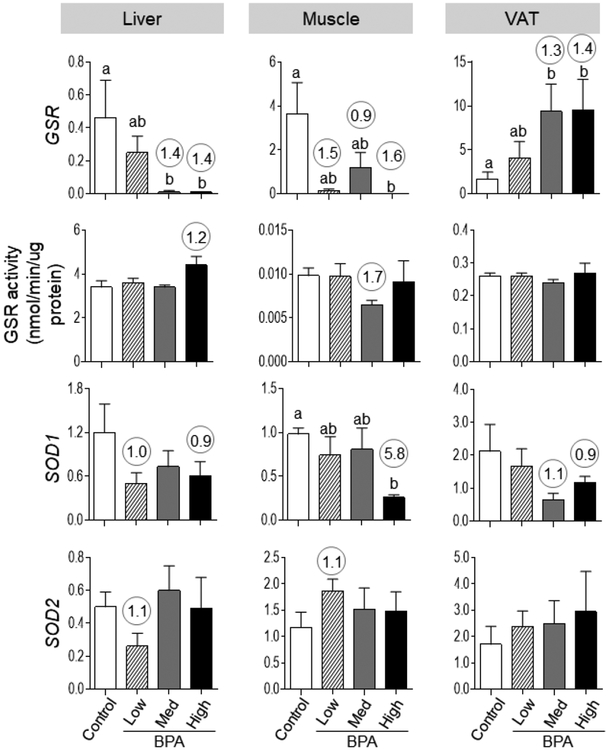
Figure 4:
Mean ± SEM antioxidant [GSR (top row), SOD1 (middle-lower row) and SOD2 (bottom row)] expression in the liver (left), muscle (middle) and VAT (right panel) tissues of control, BPAlow, BPAmed and BPAhigh dose prenatal BPA-treated groups. Mean ± SEM of enzymatic activity of GSR are also shown for these different tissues and treatment groups in middle-top panel. Differing alphabets above the histogram (GSR in liver, muscle and VAT, SOD1 in muscle) indicate statistically significant differences by ANOVA (a vs. b: p<0.05; ab not different from a or b) and numerical superscripts are Cohen’s d values ≥ 0.8 comparing control and different dose groups of BPA.

