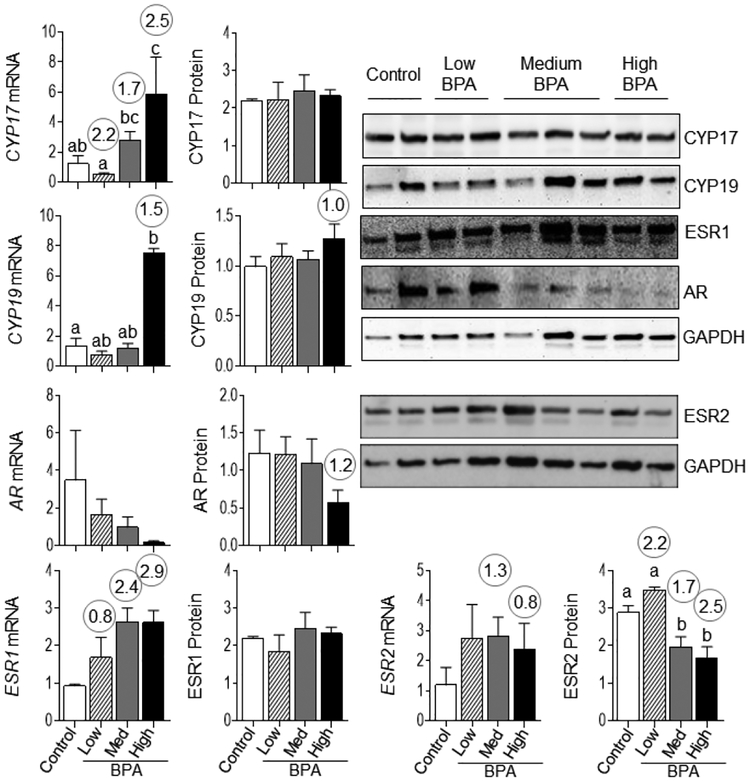
Figure 7:
Changes in steroidogenic enzymes CYP19 and CYP17, and steroid receptors ESR1, ESR2 and AR mRNA and protein expression in VAT from control, BPAlow, BPAmed and BPAhigh dose prenatal BPA-treated groups are shown. Gene expression was quantified by RT-PCR and presented as mean ± SEM of fold changes of treated vs. control samples. Protein content was determined by immunoblotting and mean ± SEM of ratio of densitometric values for the respective protein to GAPDH are plotted. Representative immunoblots are shown in the right side of the panel. Differing alphabets above the histogram indicate significant changes by ANOVA and numerical superscript are Cohen’s d values ≥ 0.8 comparing control and different dose groups of BPA. Differing letters in histograms (CYP17 and CYP19 mRNA) indicate statistically significant differences by ANOVA (a vs. b: p<0.05; ab not different from a or b).

