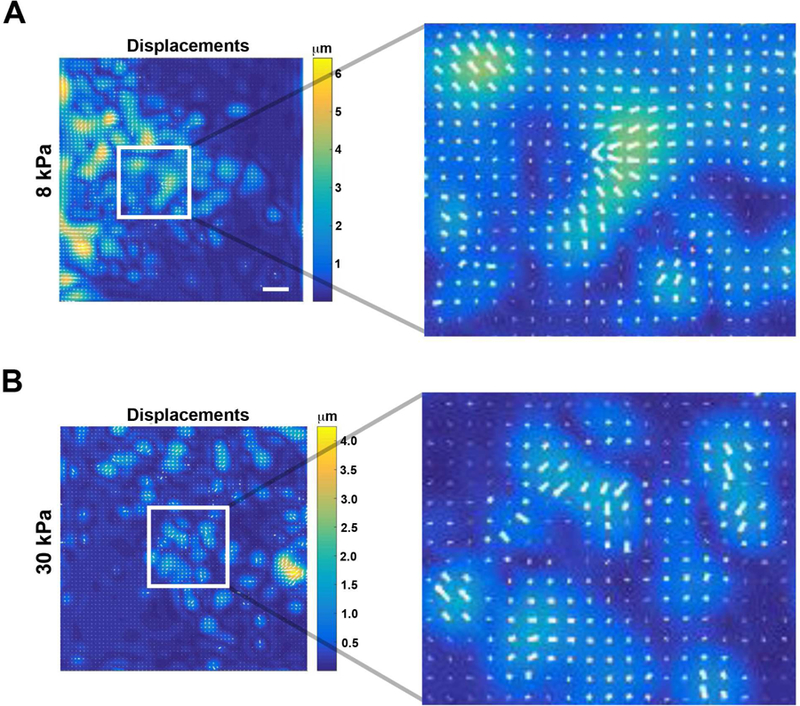
Figure 2. Traction force analysis was performed and displacement vectors indicate epithelial sheet movement.

Traction force analysis was performed on epithelial sheets placed on 8 and 30 kPa gels using FTTC. Enlargements of insets show vectors (white) within a region of an 8 and 30 kPa gel. Scale bar is 400 µm.
