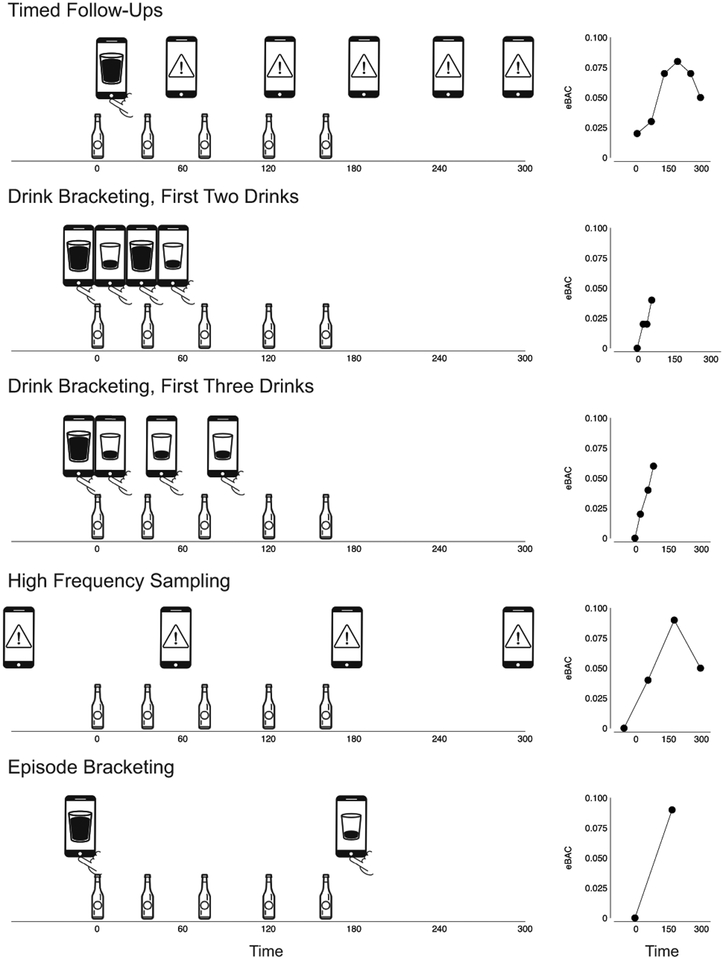
Figure 1.
Schematics (left) depicting how various high-resolution EMA designs from the existing literature might apply to a single hypothetical drinking episode involving consumption of five drinks. In this Timed Follow-Ups example, a user-initiated first drink report (depicted as phone with a drink icon) is logged shortly after completing the first drink, triggering prompted follow-up assessments (alert phone icon) at 60 minute intervals. The sequence ceases after no new drinks are reported in two consecutive follow-ups. In the Drink Bracketing, First Two Drinks example, the user logs begin-drink reports (depicted as full drink phone icon) just before each of the first two drinks in the episode and end-drink reports (empty drink phone icon) after each the first two drinks. In the Drink Bracketing, First Three Drinks example, the user logs a begin-drink report prior to the first drink and end-drink reports after each of the first three drinks. In the High Frequency Sampling example, prompted assessments are collected at two-hour intervals and each assessment asks the user to report the number of drinks consumed since the prior report. In the Episode Bracketing example, the user logs a begin-drink report prior to consuming the first drink and an end-drink report after completing the drinking episode. Estimated BAC points (right) are plotted for each EMA assessment example. The eBAC data points are plotted for each time point where drinking information and other self-report data are collected by the corresponding assessment scheme. Estimates were generated using the formula of Matthews and Miller (1979) and assuming the drinker was a 150 lb. female. Note that, when applied to a single drinking episode, the different EMA protocols produce varying numbers of data points, cover different time intervals and the portions of the eBAC range, and vary in the extent to which they capture moments associated with falling eBAC.

