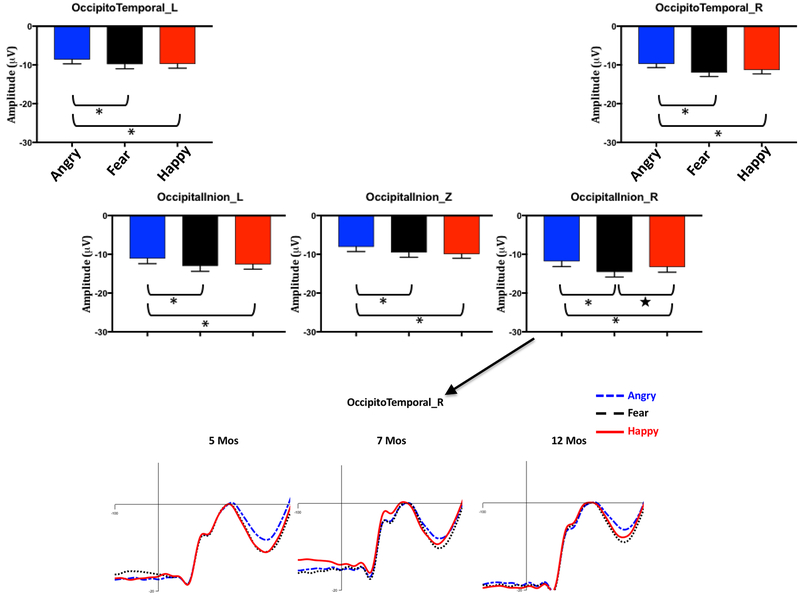
Figure 3.
The top panel shows the peak-to-peak N290 amplitude for the three emotion conditions, separately for the five posterior channel clusters and collapsed across ages, i.e., the interaction between emotion and cluster. The error bars stand for the standard errors of mean. *p < 0.05 with Bonferroni correction for the 15 (3 × 5) comparisons. ★ p < 0.05 with LSD adjustment for comparisons. The bottom panel shows the N290 component corrected for the pre-positive peak in the right OccipitalInion cluster for the three emotion conditions, separately for the three ages.

