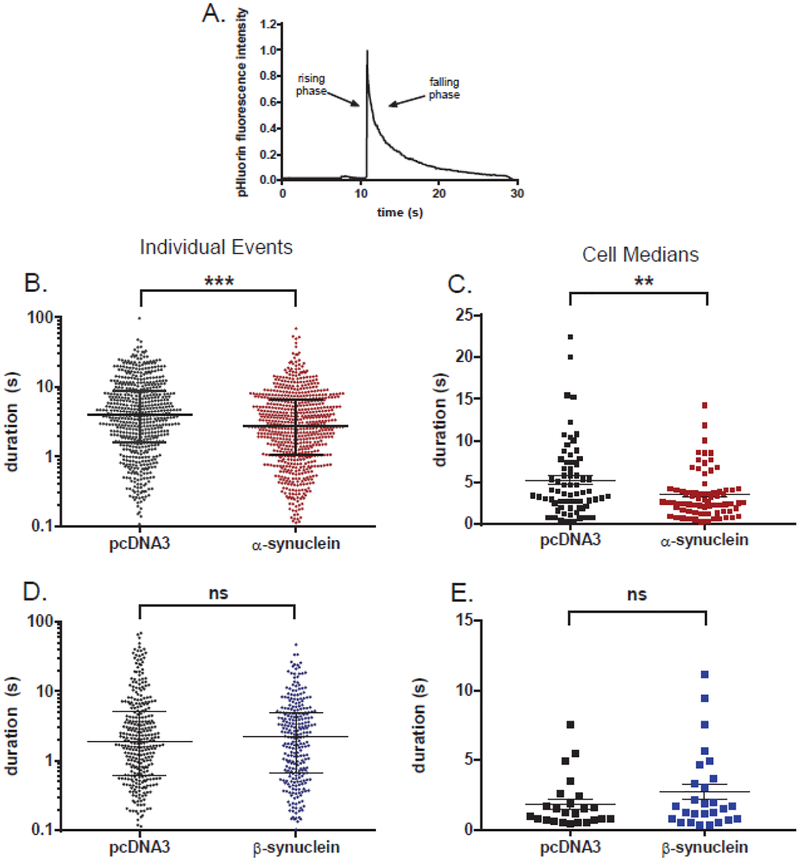
Fig. 2. α-Synuclein but not β-synuclein speeds the post-fusion discharge of BDNF-pHl.
(A) An example of the discharge of BDNF-pHl from a secretory granule upon fusion. (B) Scatter plot of event durations for α-synuclein-transfected cells and control cells (n=685 and 598 events, respectively). Note that the ordinate is log scale. ***, p = 0.0001 (Kolmogorov-Smirnov test). (C) Scatter plot of the median BDNF-pHl duration in each α-synuclein cell and control cell with greater than five events (n=73 and 67 cells, respectively). **, p = 0.006 (Student’s t-test). (D) Scatter plot of all event durations for β-synuclein-transfected and control cells (n=277 and 327 events, respectively). ns, non-significant difference (Kolmogorov-Smirnov test). (E) Scatter plot of the median BDNF-pHl duration in each β-synuclein-transfected and control cell with greater than five events (n=27 and 24 cells, respectively). ns, Student’s t-test. Horizontal bars indicate the median (longest bar) and the upper and lower quartiles in B and D. The mean of the cell medians (longest horizontal bar) and SEM (error bars) are shown in C and E.

