Figure 2.
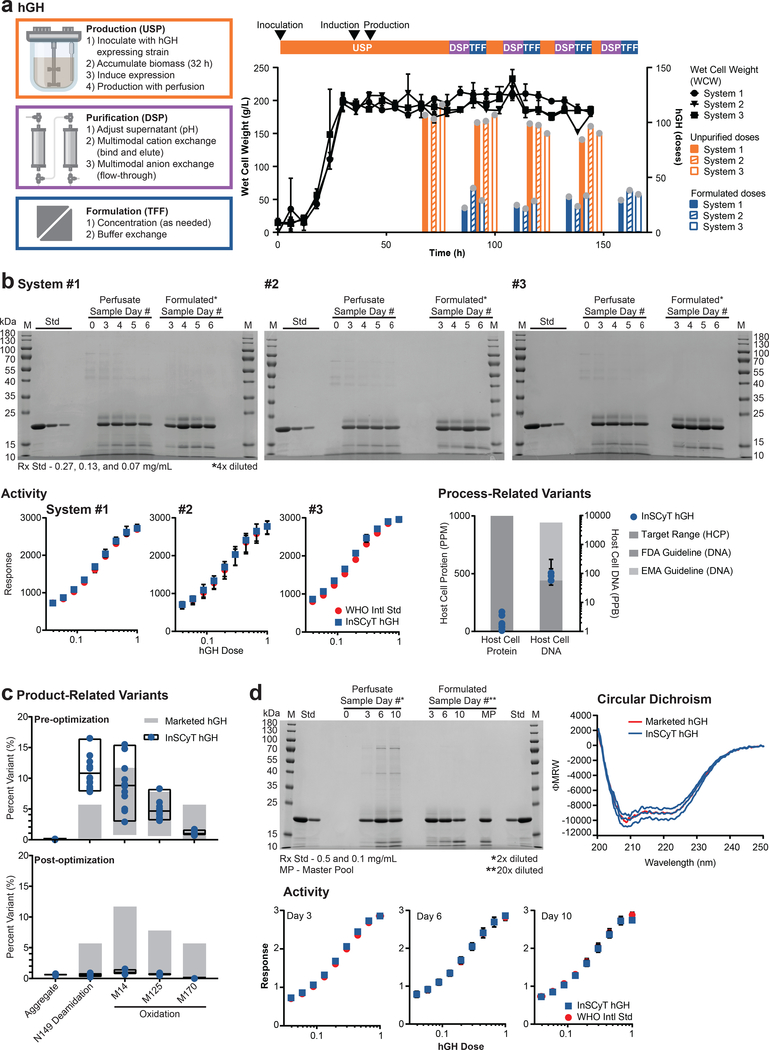
Production of hGH on the InSCyT system. Dose size used was 1.75 mg12. Center values and error bars represent the mean and range, respectively, of technical triplicates unless otherwise indicated. (a) Process flow chart (left), timeline and yields (right) for production of hGH using InSCyT. Wet cell weight (WCW) (black), unpurified (orange) and formulated (blue) doses of hGH produced are shown. Grey circles represent individual data points. (b) Product quality analyses for InSCyT-produced hGH pre-optimization alongside a reference drug substance from a licensed hGH product produced in E. coli. SDS-PAGE (12% tris-glycine) analysis of samples from the USP during biomass accumulation and production (perfusate samples), final, formulated samples (formulated samples) and the reference (Std). Activity of InSCyT hGH alongside the WHO international standard (NIBSC 98/574). The final formulated sample (day 6) was analyzed from each system. Quantification of host-cell protein and host-cell DNA impurities in formulated InSCyT hGH. Host-cell protein limits are shown as a target range14,15. Host-cell DNA guidelines are based on 100 pg/dose (FDA) and 10 ng/dose (EMA)16,30. For host-cell protein data, each point represents a unique sample (12 points total; 4 time points from each of three InSCyT systems). For host-cell DNA, data each point represents a single pooled sample from each system comprising equal volumes of samples from each time point (3 points total; 1 per system). (c) Analysis of product-related variants in formulated InSCyT hGH pre-optimization (top) and post-optimization (bottom) alongside levels typically found in marketed products (Supplementary Fig. 5). Each data point represents a unique sample; there are 12 data points for pre-optimization runs (four time points from each of three InSCyT systems) and 3 data points for post-optimization runs (three time points from a single InSCyT system). Black boxes represent the range of InSCyT hGH samples with an additional line at the mean. (d) Product quality analyses for InSCyT produced hGH post-optimization alongside reference drug substance from a licensed hGH product. SDS-PAGE (12% tris-glycine) analysis of samples from the USP during biomass accumulation and production (perfusate samples), final, formulated samples (formulated samples) and the reference (Std). Activity of InSCyT hGH alongside the WHO international standard (NIBSC 98/574). Secondary structure analysis of InSCyT hGH (individual formulated samples from days 3, 6, and 10) and the reference hGH standard using circular dichroism (CD).

