Figure 4.
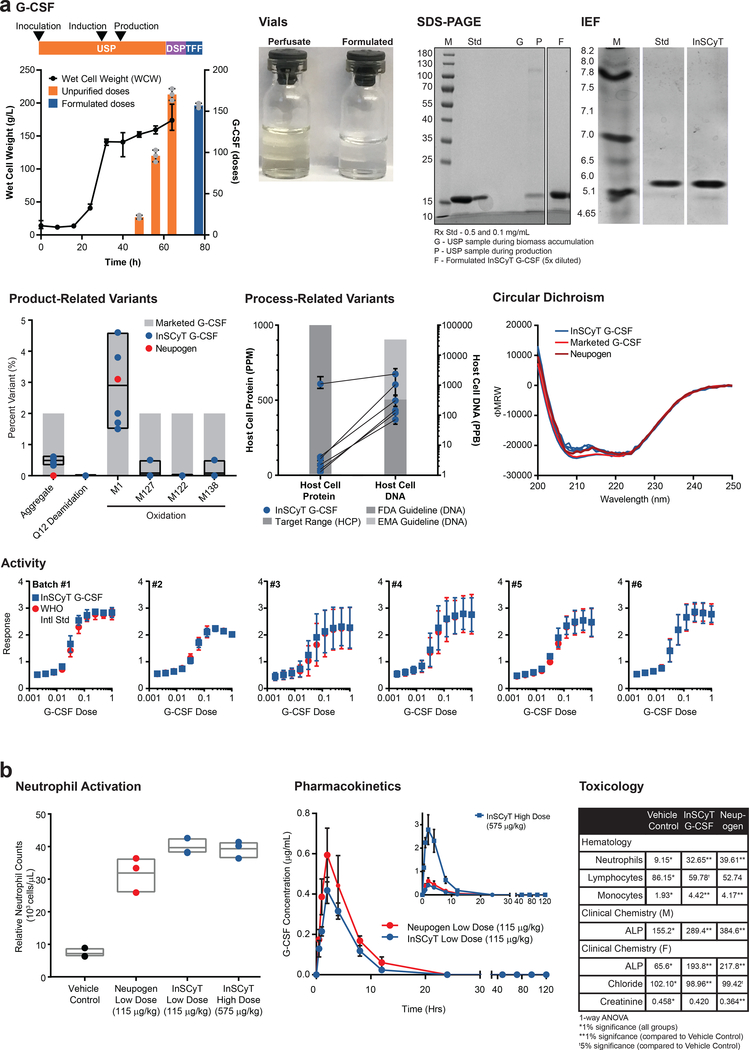
Production of G-CSF on three identical InSCyT systems. Dose size 300 μg24. Center values and error bars represent the mean and range, respectively, of technical triplicates unless otherwise noted. (a) Timeline and yields for production of G-CSF using the InSCyT system for a single representative sample (Batch #1). Wet cell weight (WCW) (black circles) and cumulative unpurified (orange) and formulated (blue) doses of G-CSF are shown. Grey circles represent individual data points. Product quality for InSCyT-produced G-CSF alongside drug substance from a licensed product produced in E. coli and Neupogen® (produced by Amgen in E. coli). A photo of vials comparing material sampled from the USP (perfusate) to final formulated material (formulated). SDS-PAGE (12% tris-glycine) analysis of Batch #1 from the USP during biomass accumulation (G) and production (P), and a final, formulated InSCyT sample (F) alongside drug substance from a licensed product (Std). Analysis of product purity by isoelectric focusing (IEF) for formulated Batch #1. Gel analyses of Batch #1 are representative of all six batches (Supplementary Fig. 9). Analysis of product-related variants and process-related variants. Each data point represents a unique batch (2 time points from each of 3 distinct systems). Paired data points indicate analyses from a single batch. Product-related variants are shown alongside levels typically found in marketed products (Supplementary Fig. 5). Black boxes represent the range of InSCyT G-CSF samples with an additional line at the mean. Process-related variants are shown alongside common guidelines (per Fig. 2b). Analysis of the secondary structures of InSCyT G-CSF (Batches 1–6) and a reference drug substance from a licensed product using circular dichroism (CD). Activity of InSCyT G-CSF alongside that of the WHO International standard (NIBSC 09/136). (b) Analysis of pharmacokinetics (PK), pharmacodynamics (PD), and toxicology of InSCyT-produced G-CSF and a licensed product (Neupogen®) in a rat model. Neutrophil activation and pharmacokinetic profile of low dose (115 μg/kg, n=3 animals, t1/2 = 2.1 h) and high dose (575 μg/kg, n=3 animals, t1/2 = 4.6 h) InSCyT G-CSF in rats compared to Neupogen (115 μg/kg, n=3 animals, t1/2 = 1.4 h) (PK: p=0.9963, Kolmogorov-Smirnov test). For neutrophil activation, grey boxes represent the range of three individual animals with an additional line at the mean. For PK center points and error bars represent the mean and range, respectively, of three individual animals. Summary of statistically significant results comparing the toxicology of InSCyT G-CSF and Neupogen® to a vehicle control. Values represent the mean; standard deviation and sample size can be found in Supplementary Fig. 11. Statistical significance was determined by one-way ANOVA. ALP – alkaline phosphatase

