
Figure 7:
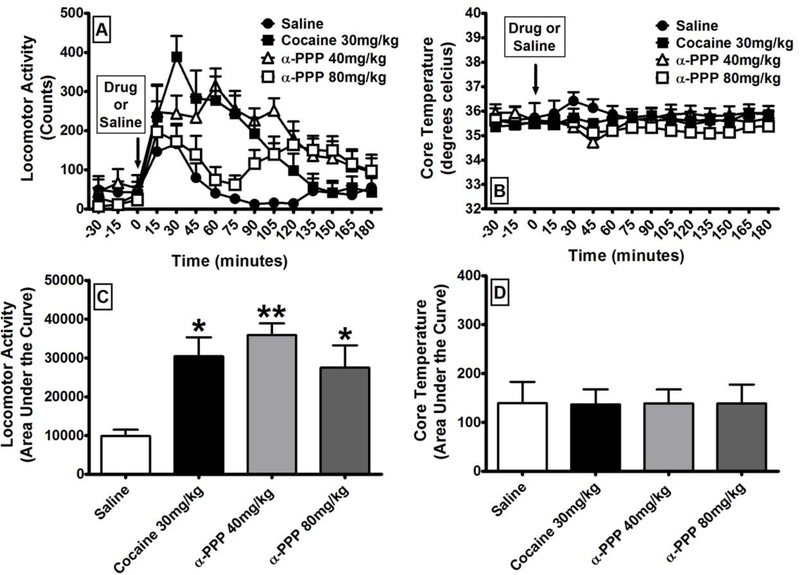
The effects of α-PPP on locomotor activity and core temperature (N=6). (A) Time course of the locomotor-stimulant effects of α-PPP in comparison to cocaine and to saline. (B) Time course of the effects of α-PPP on core temperature in comparison to saline. (C) Area under the curve of the locomotor-stimulant effects of α-PPP in comparison to cocaine and to saline. (D) Area under the curve of the effects of α-PPP on core temperature in comparison to saline. All values are the means ± SEM. * = p < 0.05; ** = p < 0.01 as assessed by one-way analysis of variance and Tukey’s post-hoc test.