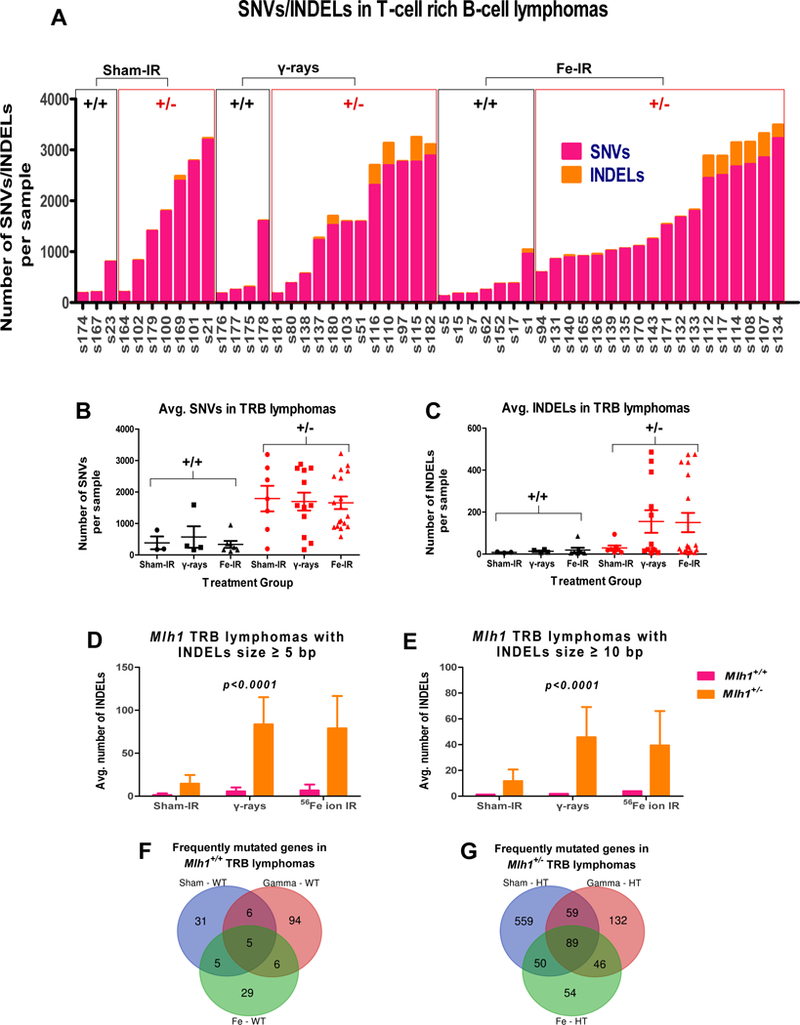
Figure 5: WES analysis of Mlh1+/+ and Mlh1+/− TRB lymphomas.

(A) Number of SNVs and INDELs found in each TRB lymphoma arising from sham- (n = 3 and 7 for Mlh1+/+ and Mlh1+/−, respectively), γ-rays (n = 4 and 12 for Mlh1+/+ and Mlh1+/−, respectively), or 56Fe ion irradiation (n = 7 and 12 for Mlh1+/+ and Mlh1+/−, respectively). (B) Average number of SNVs per Mlh1+/+ and Mlh1+/− cohorts. (C) Average number of INDELs per Mlh1+/+ and Mlh1+/− cohorts. (D) Size of INDELs ≥ 5 bp in each cohort of Mlh1+/+ and Mlh1+/− TRB lymphomas. (E) Size of INDELs ≥ 10 bp in each cohort of Mlh1+/+ and Mlh1+/− TRB lymphomas. Venn Diagram shows number of frequently mutated genes found in (F) Mlh1+/+, and (G) Mlh1+/− cohorts. P values were determined by a two-way ANOVA model. Data plotted are means ± SEM.
