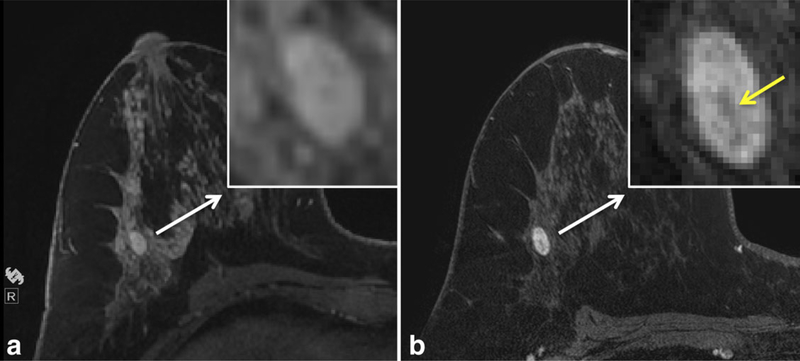
Figure 4.
Comparison of the imaging appearance at different field strengths of a biopsy-proven fibroadenoma in a high-risk patient. Dynamic contrast enhanced (DCE) MRI at 1.5T (a) demonstrates an oval shaped mass measuring 10 mm in size with smooth margins (inset). Scan obtained at 3T (b) demonstrates a dark internal septation (yellow arrow, inset) within the oval mass that was not previously resolved at 1.5T, a specific finding of fibroadenomata. Detailed scan parameters for breast MRI at 1.5T and 3T at the University of Washington are summarized in Table 3.

