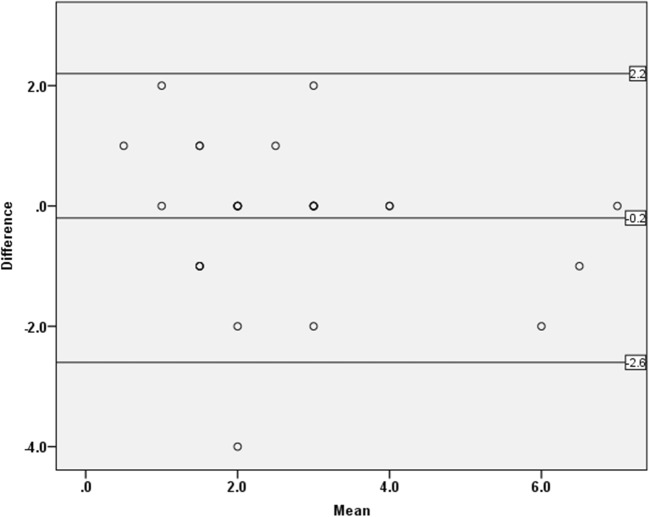
Fig. 3.
Bland-Altman plot for inter-reader agreement of medial meniscal extrusion measurement. Upper line = upper 95% Bland-Altman confidence interval, lower line = lower 95% Bland-Altman confidence interval, mid line = mean difference. Some dots are superimposed due to participants having the same values of both the mean and difference in medial meniscal body extrusion

