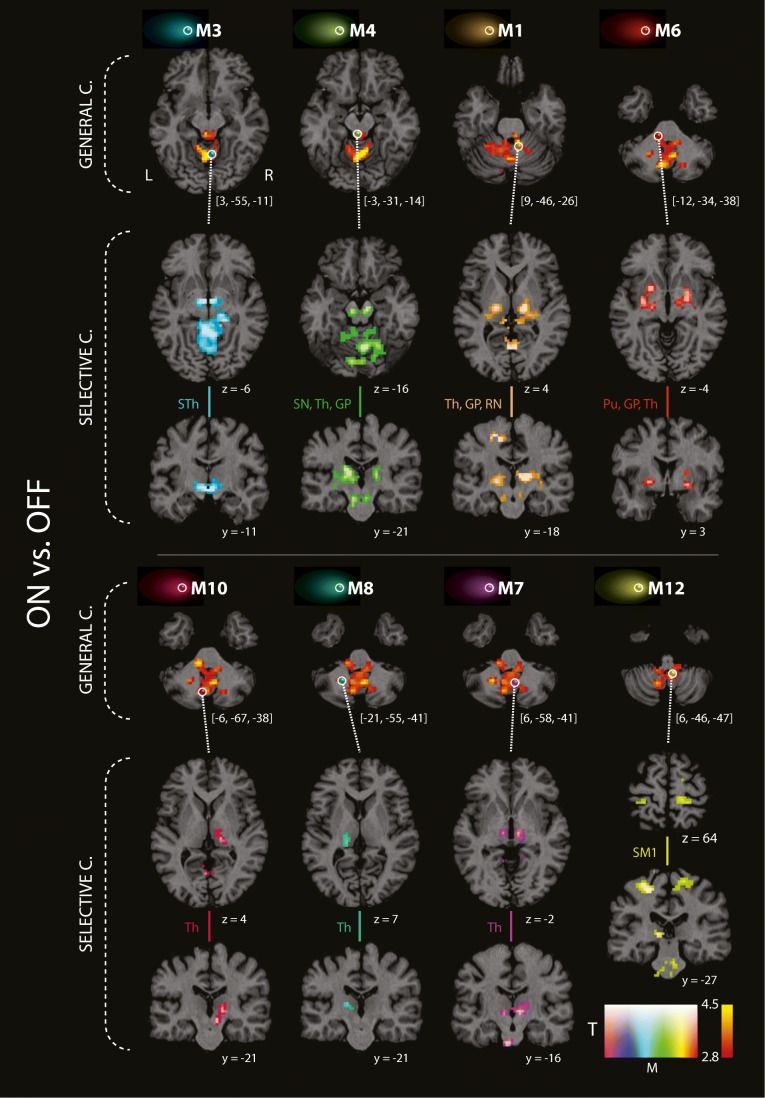
Fig. 2.
Resting-state fMRI connectivity increase of general and selective connectivity in PD patients (N = 24) in the ON compared to the OFF condition. The general connectivity increase (eigenvector centrality analysis; contrast ON vs. OFF condition) in cerebellum and brainstem are shown in the first and the fourth row of images (red-yellow clusters). The selective connectivity increase (correlation analysis; contrast ON vs. OFF condition) between eight seed voxels and extra-cerebellar brain structures are shown in rows 2 and 3 and in rows 5 and 6 (rainbow color clusters). The columns are sorted with respect to the z coordinate of each seed voxel displayed as color spheres on the general connectivity maps. Seed voxel locations and positions of the coronal and axial slices are shown using the coordinates in the MNI space. Color-coded clusters show areas with connectivity increase in the ON as compared to the OFF condition. All analyses were restricted by mask shown on Fig. 1; however, results of all seed-based correlations were also significant in full-brain analyses including family-wise error (FWE) correction at the whole-brain level (p < 0.05 at the cluster level). C connectivity, GP globus pallidus, Pu putamen, SM1 primary sensorimotor cortex, SN substantia nigra, STh subthalamus, RN red nucleus, Th thalamus

