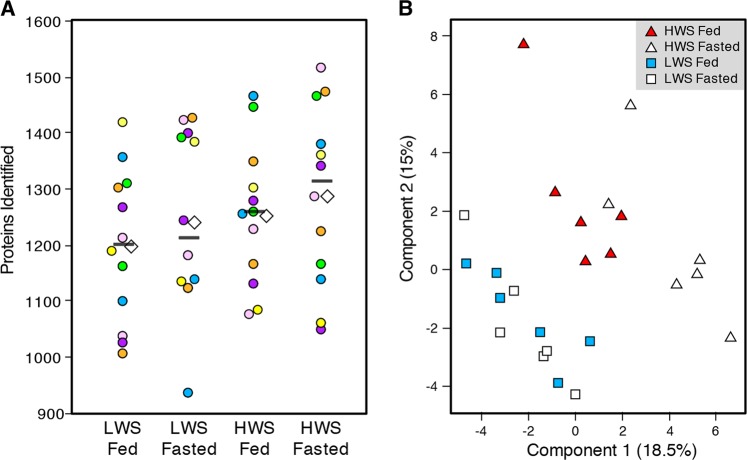
Fig. 1. Overview of proteomic analysis of the chicken hypothalamus.
a The number of proteins identified in each of the four groups. Each colored circle (yellow, blue, orange, green, purple, or pink) is a biological replicate with two per experimental unit (individual chick), with the two representing injection replicates. The white diamond is the average of all runs for that condition and the black bar is the median. LWS low body weight-selected line, HWS high body weight-selected line, Fed ad libitum feeding conditions, Fasted fasted for 3 h prior to sample collection. b Principal component analysis (PCA) of all samples (each square or triangle is an individual bird). White triangle: HWS Fasted group, red triangle: HWS Fed group, white square: LWS Fasted group, and blue square: LWS Fed group

