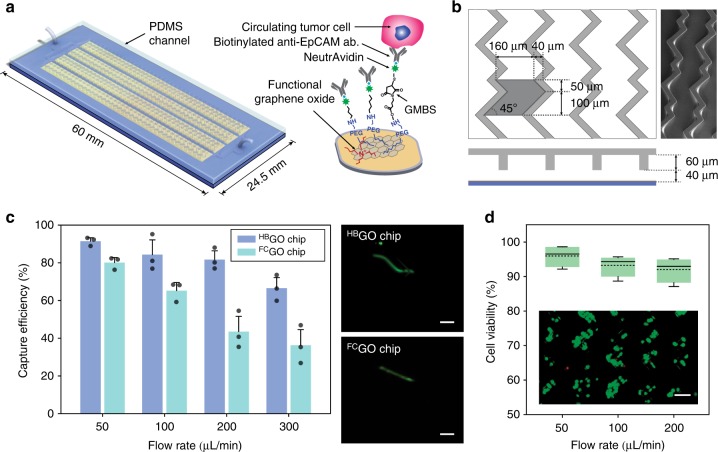
Fig. 2.
Ex vivo evaluation of HBGO chip for CTC capture. a Schematic of the HBGO chip and the conjugation chemistry between functional graphene oxide and anti-EpCAM antibody. b Schematic and micrograph of the herringbone grooved channel geometry. c CTC isolation performance of the HBGO chip compared with the FCGO chip (data points are means ± s.d., n = 3). A fluorescent labeled single MCF7 cell traveling within the two different channels shows difference in cell trajectory. d Measure of cell viability as a function of flow rate after capture (dotted line is the mean, n = 4). Inset: fluorescence microscope image of MCF7 cells stained with live/dead assay. Viable cells are shown in green. All scale bars represent 100 µm. Source data are available in the Source Data file

