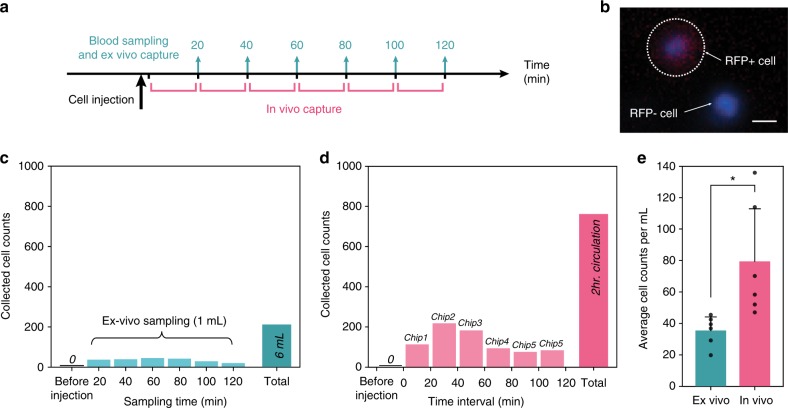
Fig. 4.
Comparison of MCF7 cells detected by ex vivo versus in vivo CTC isolation method. a Schematic illustrating the workflow of the experiment. b Fluorescence microscope image of RFP transfected MCF7 cell with RFP negative leukocyte. The scale bar represents 10 µm. c Number of MCF7 cells collected from six serial sampling of blood and its total by ex vivo isolation using the HBGO chip. d MCF7 counts from six serial chips replaced during in vivo cell enrichment and its total number of cells. e Comparison between total number of cells recovered per mL from ex vivo versus in vivo isolation method (data points are means ± s.d., n = 3, two-tailed paired t-test P < 0.05*, t = 3.39). Source data are available in the Source Data file

