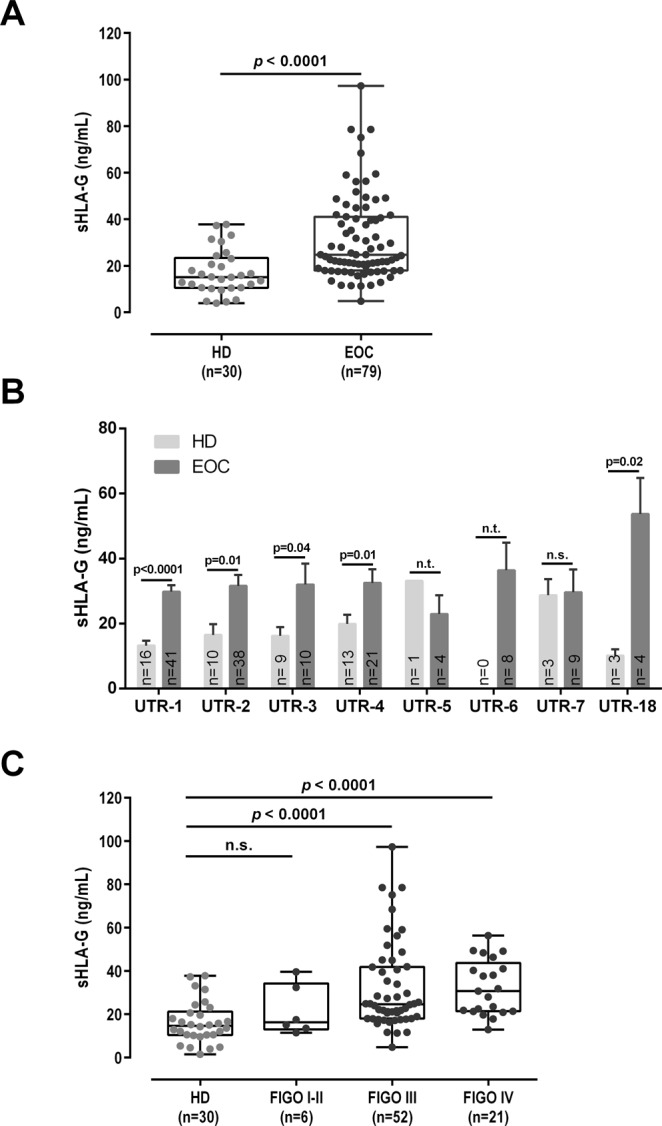
Figure 1.

Comparison of sHLA-G levels of EOC patients and healthy donors. (A) sHLA-G is significantly (p < 0.0001) elevated in EOC compared to healthy donors (HD). (B) Elevated sHLA-G levels in EOC are independent of a specific HLA-G 3′UTR haplotype. Bars indicate mean value ± SEM. (C) sHLA-G levels increase with ascending FIGO stage in EOC patients without reaching significance. sHLA-G levels are given in ng/ml. Statistic was performed by Mann-Whitney test (A,C), or Kruskal-Wallis with Dunn’s test for multiple comparison (B). n.s. not significant, n.t. not tested due to low numbers.
