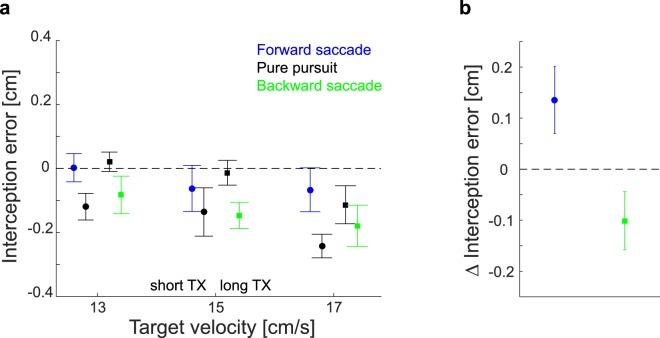
Figure 4.
Effect of corrective saccades on interception. (a) Average lateral interception errors across participants for the three different target velocities and two target crossing times (TX) separated by the oculomotor behavior. Black symbols show responses for pure pursuit trials. Blue and green symbols indicate trials with forward and backward saccades, respectively. Circles show the data for the short TX. Squares show the data for the long TX. The data points for each velocity have been spread horizontally to improve visibility. An error of 0, shown by the black dotted line, would indicate tapping at the center of the target. Positive errors indicate hitting in front of the target center. (b) Summary of the effect of corrective saccades on interception errors: difference between trials with corrective saccades and the corresponding pursuit trials (averaged across the three target velocities). All error bars represent the standard error of the mean across participants’ average values.

