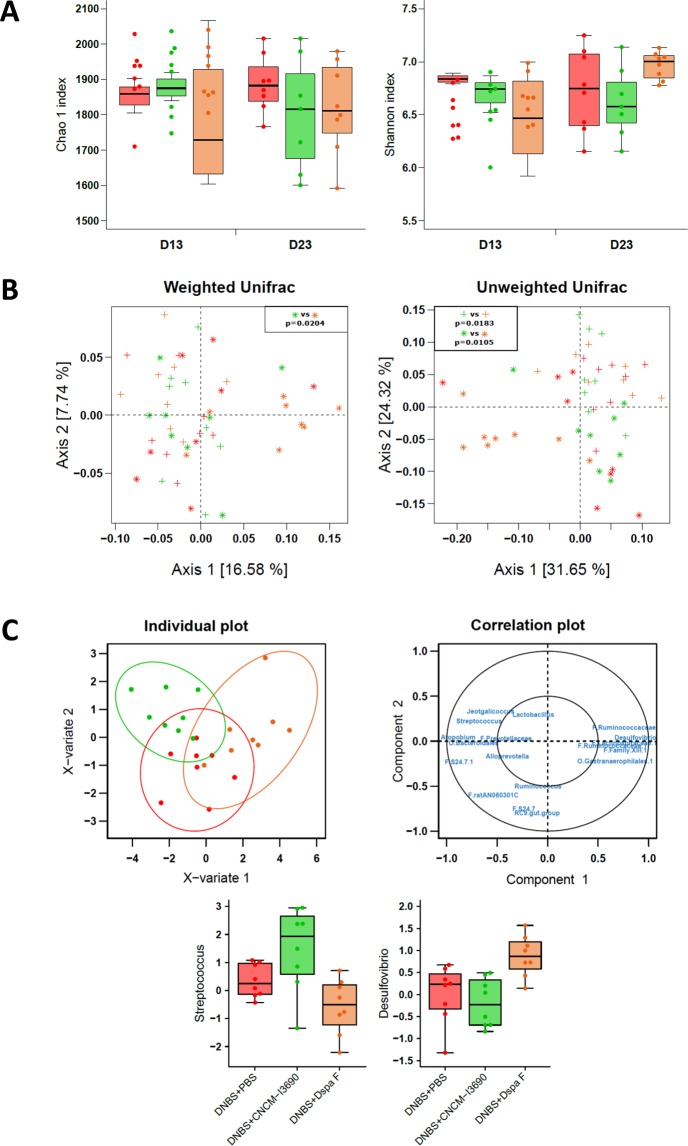
Figure 6.
Microbiota analysis. Alpha diversity (Chao1 estimators and Shannon indices) was analyzed using a repeated measures two-way ANOVA on the D0 and D13 values, and a one-way ANOVA on the D13-adjusted D23 values (A). OTU data were examined using a principal coordinate analysis of weighted and unweighted UniFrac distances, and group effects were evaluated at each time point using a permutational ANOVA (adonis function in R). Post-hoc tests used Bonferroni corrections (C). Data were also analyzed at the genus level. They were filtered (retained if more than 60% non-zeros in at least one group and mean above 0.01% in at least one group). A PLS-DA was performed on the log ratios of abundance between D23 and D13 to discriminate among the three groups (two components). Individual plots with 95% confidence ellipses and a correlation plot are presented. Log ratios are plotted for the genera Streptococcus and Desulfovibrio. Mice groups are as in Fig. 3, with untreated mice in red, CNCM I-23690-treated mice in green, and DspaF–treatedmice in orange; crosses and stars indicate D13 and D23 values, respectively (n = 8) (C).

