FIGURE 2.
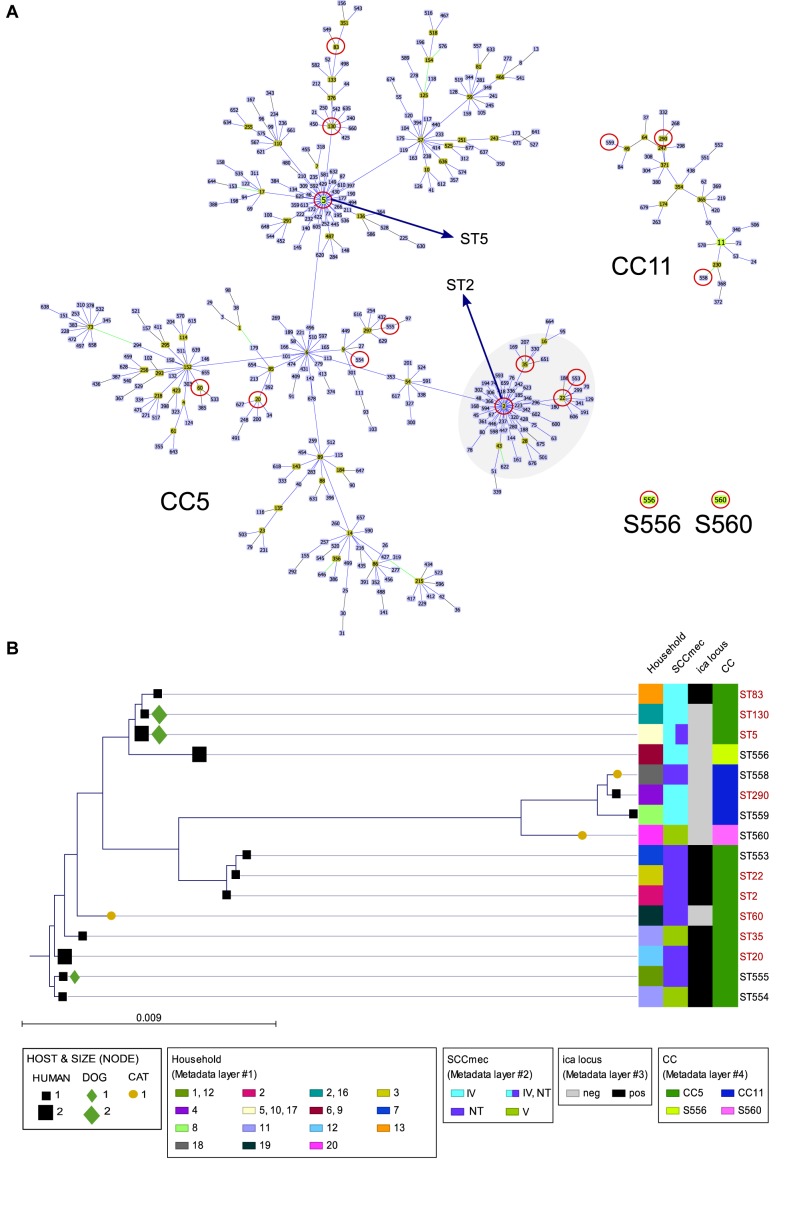
(A) Clustering analysis of the S. epidermidis STs detected in this study by goeBURST algorithm using Phyloviz 2 software (Nascimento et al., 2017). The most restricted level [level 1 – Single Locus Variant (SLV)] was used, requiring six of seven alleles shared to the linked ST. Cyan STs indicate probable ancestors (group founders) and green STs constitute subgroup founders. Blue STs correspond to STs that share the same background (CC). Circles in red indicate the STs detected in this study. Specific location of ST5 (CC5 ST primary founder) and ST2 (major subgroup founder of the cluster) within CC5 are indicated. (B) Distance tree of the 16 concatenate ST sequences detected among the 24 S. epidermidis isolates constructed using CLC Genomics Workbench 10.0.1 (https://www.qiagenbioinformatics.com/). Sequences were aligned using internal parameters, and the tree was built with a Neighbor Joining method using Jukes-Cantor as Nucleotide Distance measure, with a bootstrap analysis of 500 replicates. The bar length indicates the number of substitutions per site. STs in black color are those with new ST, either by the presence of a new allele or new allele combination.

