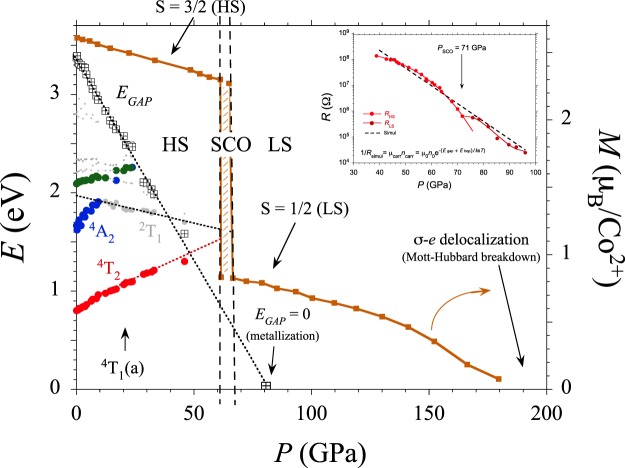
Figure 3.
Variations of the Co2+ crystal-field state energy of the 4T1(a) → Γi transition and of the charge-transfer band gap energy of CoCl2 (EGAP) with pressure. The color of the experimental points (Γi) is the same one employed for representing the energy of Γi state in the Tanabe-Sugano diagram of Fig. 1. Note that the HS-LS crossover corresponds to the 4T2(F) ↔ 2T1(G) crossing point, and the p-d band gap closure to EGAP = 0 (metallization). The continuous curves in brown color are the calculated Co2+ local moment within DFT + U method keeping the P m1 phase in the whole pressure range. The HS-LS transition and p-d band gap closure take place at 67 and 80 GPa, respectively, whereas the Mott-transition (σ-electron delocalization) in LS is found for P > 180 GPa (detailed information in Supplementary Figs S4–S7). The inset shows the variation of the electrical resistance of CoCl2 with pressure, R(P), in a semilog plot. It must be noted that R(P) behaves differently below and after 71 GPa indicating SCO transition. The change of slope above 80 GPa unveils the metallization onset. Linear dashed line corresponds to the least-square fit to R(P) taking the linear variation of p-d charge-transfer band gap, EGAP, obtained by optical absorption, and a thermal activated hoping term, Ehop(P) associated to the carrier mobility (see also Supplementary Fig. S12).

