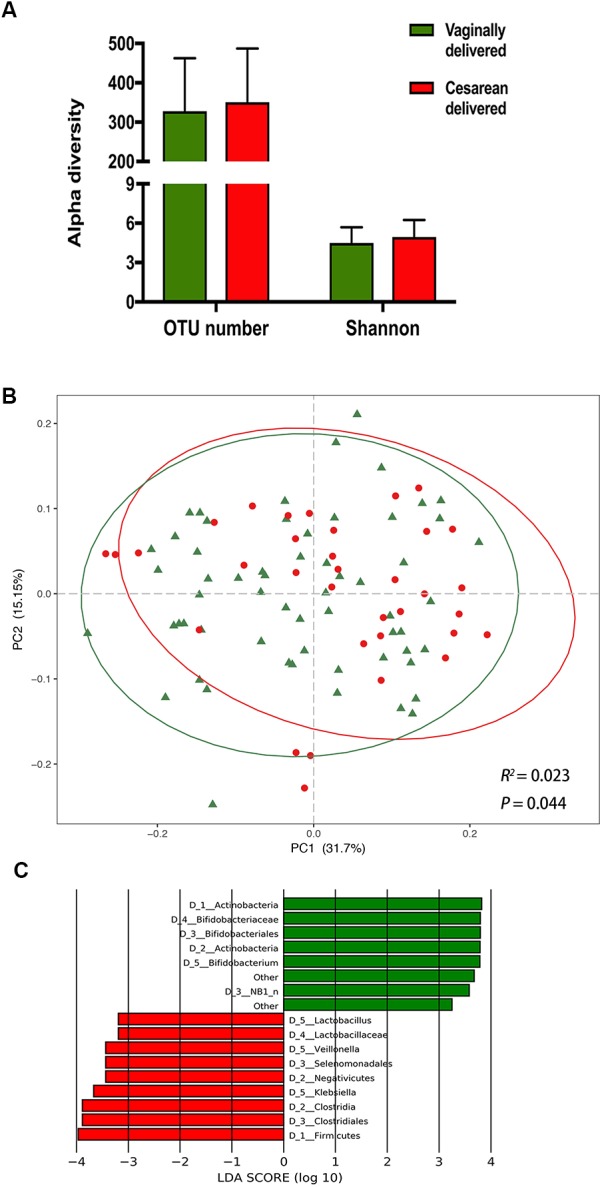
FIGURE 1.

The impact of delivery mode on infant gut microbiota. (A) Comparison of alpha diversity between vaginally delivered and cesarean delivered infants. (B) Principal coordinates analysis (PCoA) based on weighted UniFrac distances is shown along the first two principal coordinate (PC) axes with Adonis p-value. Percentages are the percent variation explained by each PC axis. Individual samples are represented by green triangles (vaginally delivered) and red points (cesarean delivered). (C) Enriched taxa of different level from vaginally delivered infants with a positive linear discriminant analysis (LDA) score are shown in green; cesarean delivered infants with negative LDA score are shown in red (cut off value ≥3).
