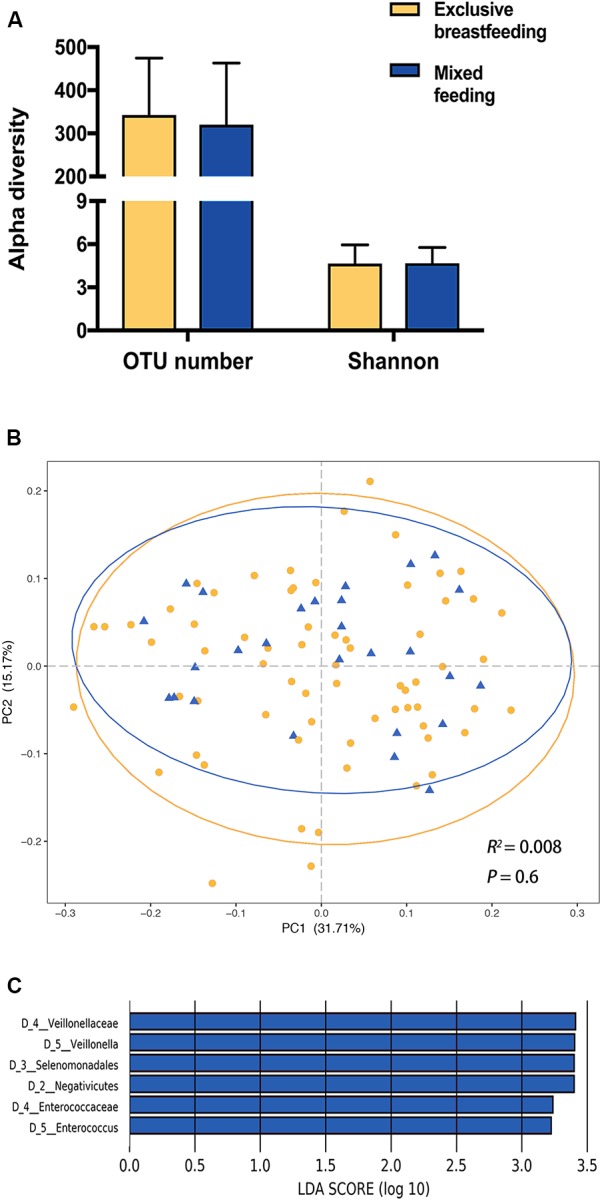
FIGURE 2.

The impact of feeding pattern on the infant gut microbiota. (A) Comparison of alpha diversity between exclusively breastfed and mixed-fed infants. (B) Principal coordinates analysis (PCoA) based on weighted UniFrac distances is shown along the first two principal coordinate (PC) axes with Adonis p-value. Percentages are the percent variation explained by each PC axis. Individual samples are represented by yellow points (exclusively breastfed) and blue triangles (mixed-fed). (C) Enriched taxa of different level from mixed-fed infants with a positive linear discriminant analysis (LDA) score are shown in blue (cut off value >3).
