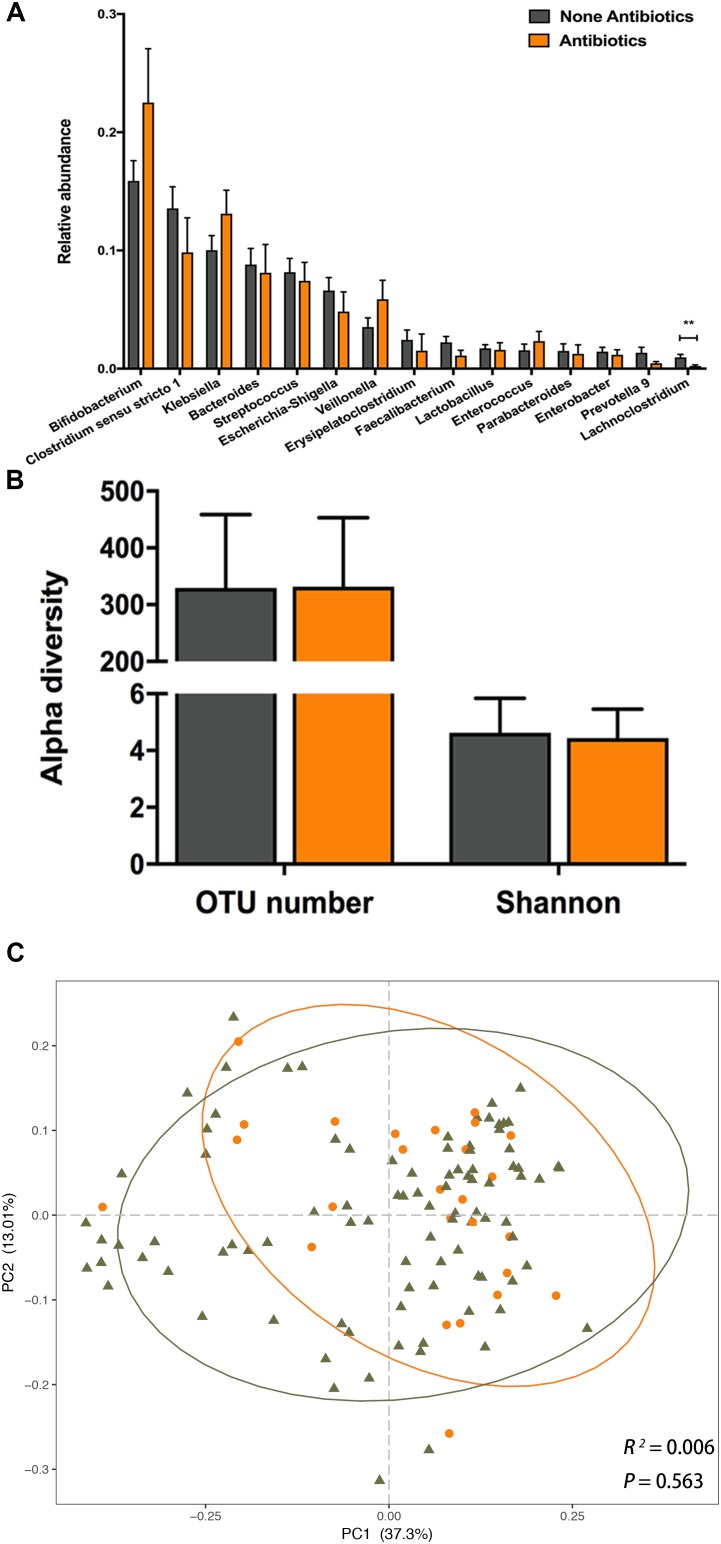
FIGURE 4.
The impact of postnatal antibiotic exposure on the infant gut microbiota. (A) Comparison of relative abundance of the top 15 genera between antibiotic exposed and unexposed infants. Significant difference was determined by Mann-Whitney U-test (∗∗p < 0.01). (B) Comparison of alpha diversity between antibiotic exposed (orange) and unexposed (dark gray) infants. (C) Principal coordinates analysis (PCoA) based on weighted UniFrac distances is shown along the first two principal coordinate (PC) axes with Adonis p-value. Percentages are the percent variation explained by each PC axis. Individual samples are represented by orange points (antibiotic exposed) and dark gray triangles (antibiotic unexposed).

